The Multi-Matrix is a powerful analytical tool that combines data visualization and analysis to provide a holistic view of market behavior. It allows for a better understanding of the probability of a trading event occurring based on historical data. The user can customize the display by choosing different types of metrics, such as volatility or opening gaps. The matrix is dynamic and can be resized to fit the specific needs of the trader, also offering the possibility to change the color scheme for easier data reading.

Example 1: I am a Trader, and I trade on one or more stocks that I have tracked for a long time and am intimately familiar with. I engage in Day, Weekly, Swing, and even Monthly trades, for example. Before initiating a trade, I ponder its potential trajectory. After analyzing the price, conducting a technical analysis, reviewing news, and considering momentum, etc., I decide whether to go LONG or SHORT. Operating under the premise that any loss should be curtailed by a money management strategy (i.e., a stop loss) I’ve set in place, if the price moves in my favor, I’d like to discern the ideal exit point. Tragically, many traders succumb to the notorious sensation of “loss aversion” and exit positions prematurely. A similar analysis is a valuable tool; it provides a historical perspective on market behaviors, offering insights into the probabilities that, under analogous conditions, a price might retract or continue its course, all based on probabilistic evaluations.
Example 2: Let’s imagine now being the same type of trader as described above, but instead of setting up a trade based on a timeframe (e.g., I will make three monthly trades over the next three months on those stocks), I base it on an opportunity that arises at that moment (e.g., volatility has increased, and a stock has already moved over 90% of the maximum historical movement predicted after only 30% of the period under consideration). In this scenario, an opportunity worth considering has emerged. The current price indicates that today is an anomalous day compared to history, and the likelihood of it continuing in that direction diminishes in favor of a price reversal. In this context, by adding appropriate additional analyses of momentum, news, etc., more informed and conscientious decisions can be made. Yet, always bearing in mind that no one can predict the future.
Example 3 (Option Trader): Those who trade with financial options will greatly benefit from this analysis as here we calculate the historical probabilities that a limit will be reached or not reached Options pivot primarily on the choice of the strike, which also determines their value. Adding a probabilistic historical analysis during the strike selection process is a significant added advantage (if you’re an options trader, you’ll have already grasped the power of such a tool). Imagine being an options seller; would you be pleased to know the historical probability of reaching each strike? And if you’re a buyer, would you want to know the historical and similar probability that a strike will be surpassed?
Example 4 (Option Trader): You’re an options seller. As you know, options are quoted by brokers based on the Black & Scholes formula, even though the actual price is always the real exchange on the market. If you’re an options trader, you know that if a price moves sharply, it increases volatility, and consequently, the value of all options across various strikes rises as the underlying price approaches. Now imagine that the price has reached a historical limit with a very low probability of being surpassed and that it has done so in a relatively short amount of time. Well, in this situation, there are strike levels that have never been reached in the past within a certain timeframe, making it advantageous to attempt speculation. This is an example of how one can uncover fields of very high probability of success under specific market conditions, fields of probability that brokers wouldn’t even quote if they could because they know the statistics and understand it’s unlikely to reach those levels… but they are obligated to quote, and those in the know can take advantage of it.
It goes without saying that an analysis of the limits can be applied to any strategy that asks the question: what is the probability that it will or will not reach a certain price within a certain period?
This means that such an analysis should be used by all traders who want to add an extra tool to their trading model.
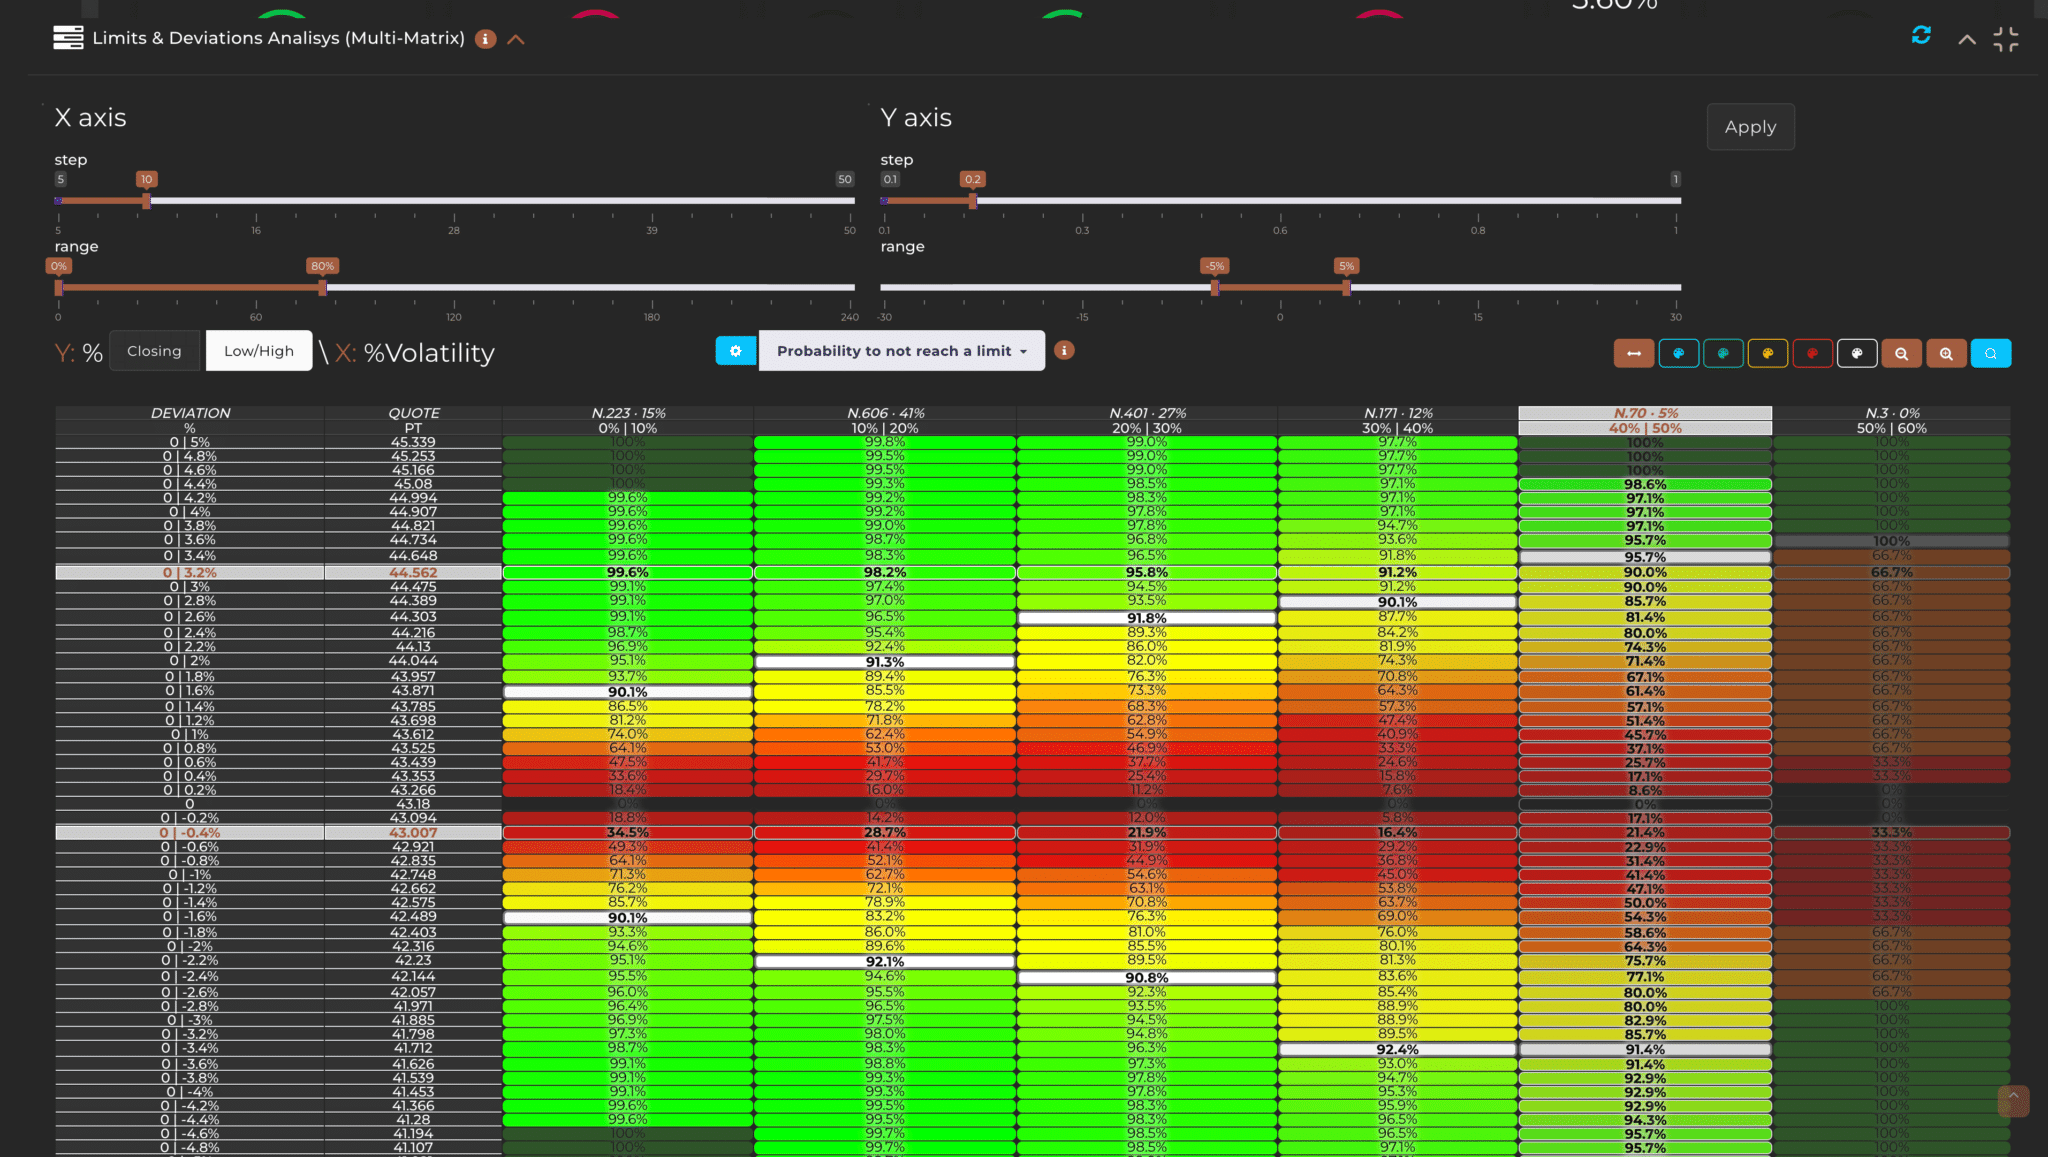
This feature answers the ultimate question for a trader: What is the probability that a price will reach a certain point within a specified period? This matrix displays the backtest of limits in relation to metrics such as volatility or the opening gap. The tool is useful for understanding the historical risks of a certain event occurring, effectively providing past probabilities and frequencies.
The display is through a matrix that shows the relationship between the price difference of a certain period and a metric between volatility and the opening gap on the previous opening (or closing). In simple terms, you can relate historical limits reached with, for example, volatility, to clearly understand the historical probabilities that a particular event will occur.
The columns of the matrix represent the Gap (or Deviation) and the Quota (or Value), followed by the columns that display the probabilities. The Gap indicates the percentage variation of the reference value, while the Quota represents the change in points or monetary units (such as euros, dollars, etc.). The probability columns are divided into two rows: the first shows the total number of cases (e.g., N. 533) for that column and the relative percentage compared to the total selected cases; the second row indicates the volatility range for which the values have been aggregated.

By positioning the mouse cursor over one of the colored percentages in the matrix, a pop-up will be activated displaying the number of cases (occurrences) corresponding to that particular grouping. The percentages are displayed with a color code that facilitates the immediate identification of the probability. For example, if you hover over the 99.8% percentage and the pop-up shows that the number of cases is 333, this indicates that from the start of the count (0%) up to 99.8%, 333 cases have accumulated. The number of cases or occurrences is therefore cumulative. To further exemplify, if at 99.8% we have 333 occurrences, while at 99.6% we have 331; therefore, with a probability increase of 0.2%, two occurrences have been added.

The measurable events in the matrix are all price deviations starting from the beginning of the period price (Daily, Weekly, Monthly, Quarter) and are expressed both as a percentage (Gap %) and in actualized value (Quote/Price) on the vertical axis. Such events are counted by dividing them into volatility (or gaps) ranges, which are positioned on the horizontal axis and expressed as a percentage (%). The events currently measured are: Closures (understood as the deviation from the end-of-period price from the start-of-period price) and Minimums and Maximums, understood as the extreme deviation during the period, clearly in two directions: negative (min) and positive (max). By default, the Maximums and Minimums are displayed.
Through a dedicated selector, it is possible to switch from the data for the minimums and maximums to that for the closures, while another selector allows you to change the second variable between Volatility and Gaps.

The matrix displays 12 different views for each reference used (e.g. volatility), selectable at the top of the matrix, and they are also divided in half between the measurable events “Close” and “Min/Max”. Essentially, there are two types of data of interest to evaluate with this matrix: the probability that an event will or will not occur (expressed in %) and the number of times (frequency or occurrence) that such event has (or has not) occurred in the past. Additionally, the distribution of limits (or closures) complements the analysis by adding quality to the obtained results. This aspect is important as it’s logical to assume that a 95% probability of success on a sample of 8 similar cases is less reliable than a 95% probability on 500 similar historical cases. The frequency is used to give significance to the probabilistic data expressed as a percentage.
Hovering over a cell with the mouse allows you to access the related data corresponding to what’s displayed. For example, if we’re observing the probability that an event does not occur, hovering over the cell will show the number of occurrences (frequencies) upon which the probability is calculated. The process also works the other way around.
Here is the list of available views accessible through a selector located above the matrix.

In the displayed matrix, we can notice cells colored in white representing the default values for the probabilities of not reaching a given limit. In the provided image, the cells with a 90% probability are highlighted in white (In the event the exact probability is not available, the closest one will be highlighted).

These default values are set to:
However, the user has the option to customize these percentages to adapt them to their own analytical needs. In the Limits & Deviations Analysis Overview function, we can modify these percentages to quickly display the highest probability.

The matrix is dynamic and its size can be adjusted to obtain more precise calculations or broader overviews with less detail. To change this size, some presets have been provided that you can modify by pressing on the magnifying glass with the “+” or “-” symbol, which respectively allow for a zoom in or zoom out of the displayed table.

By pressing on the simple magnifying glass, selectors will open to allow for a “manual” resizing of the table. The available selectors are:
Once these values are customized, you can press “Apply” to make the changes to the matrix effective.

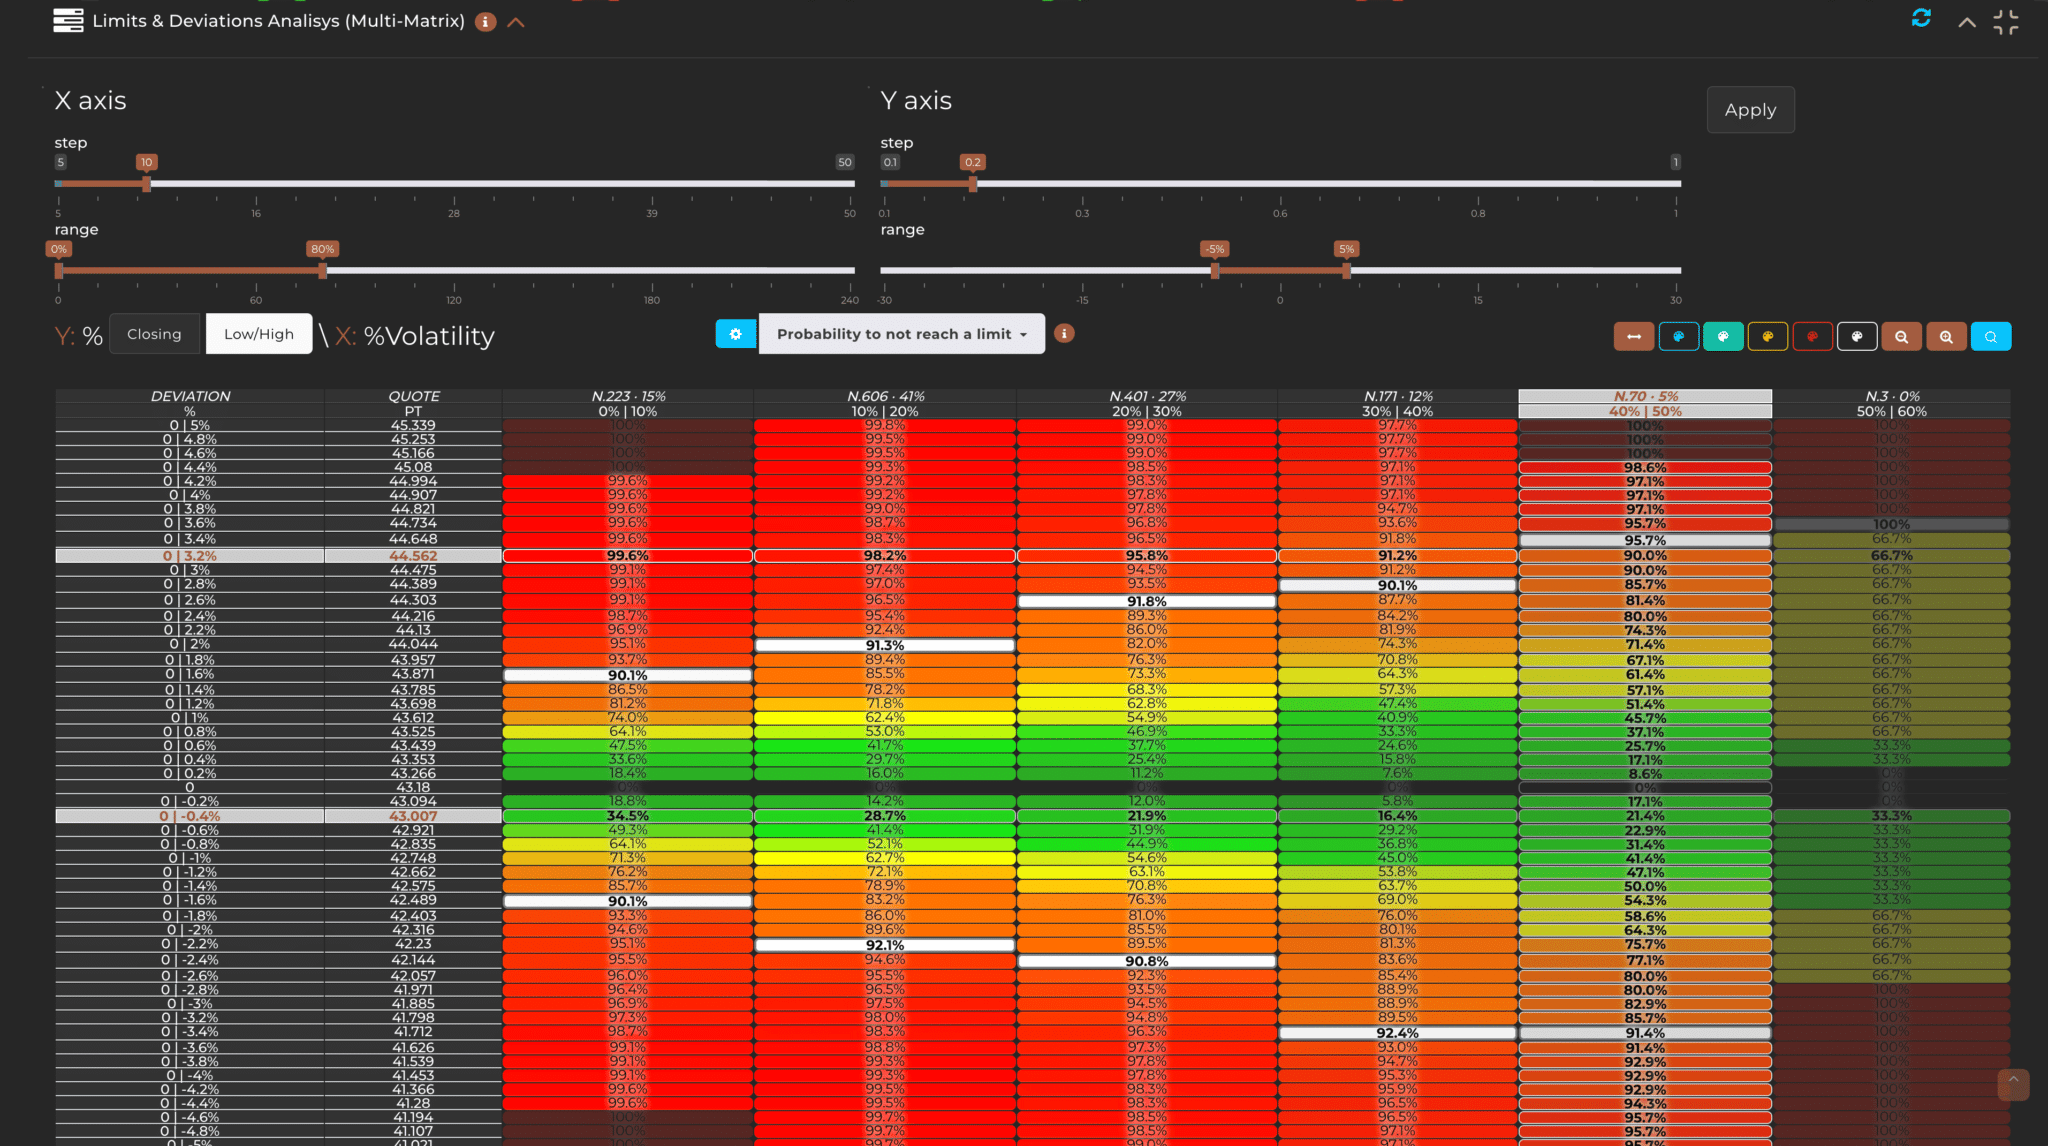
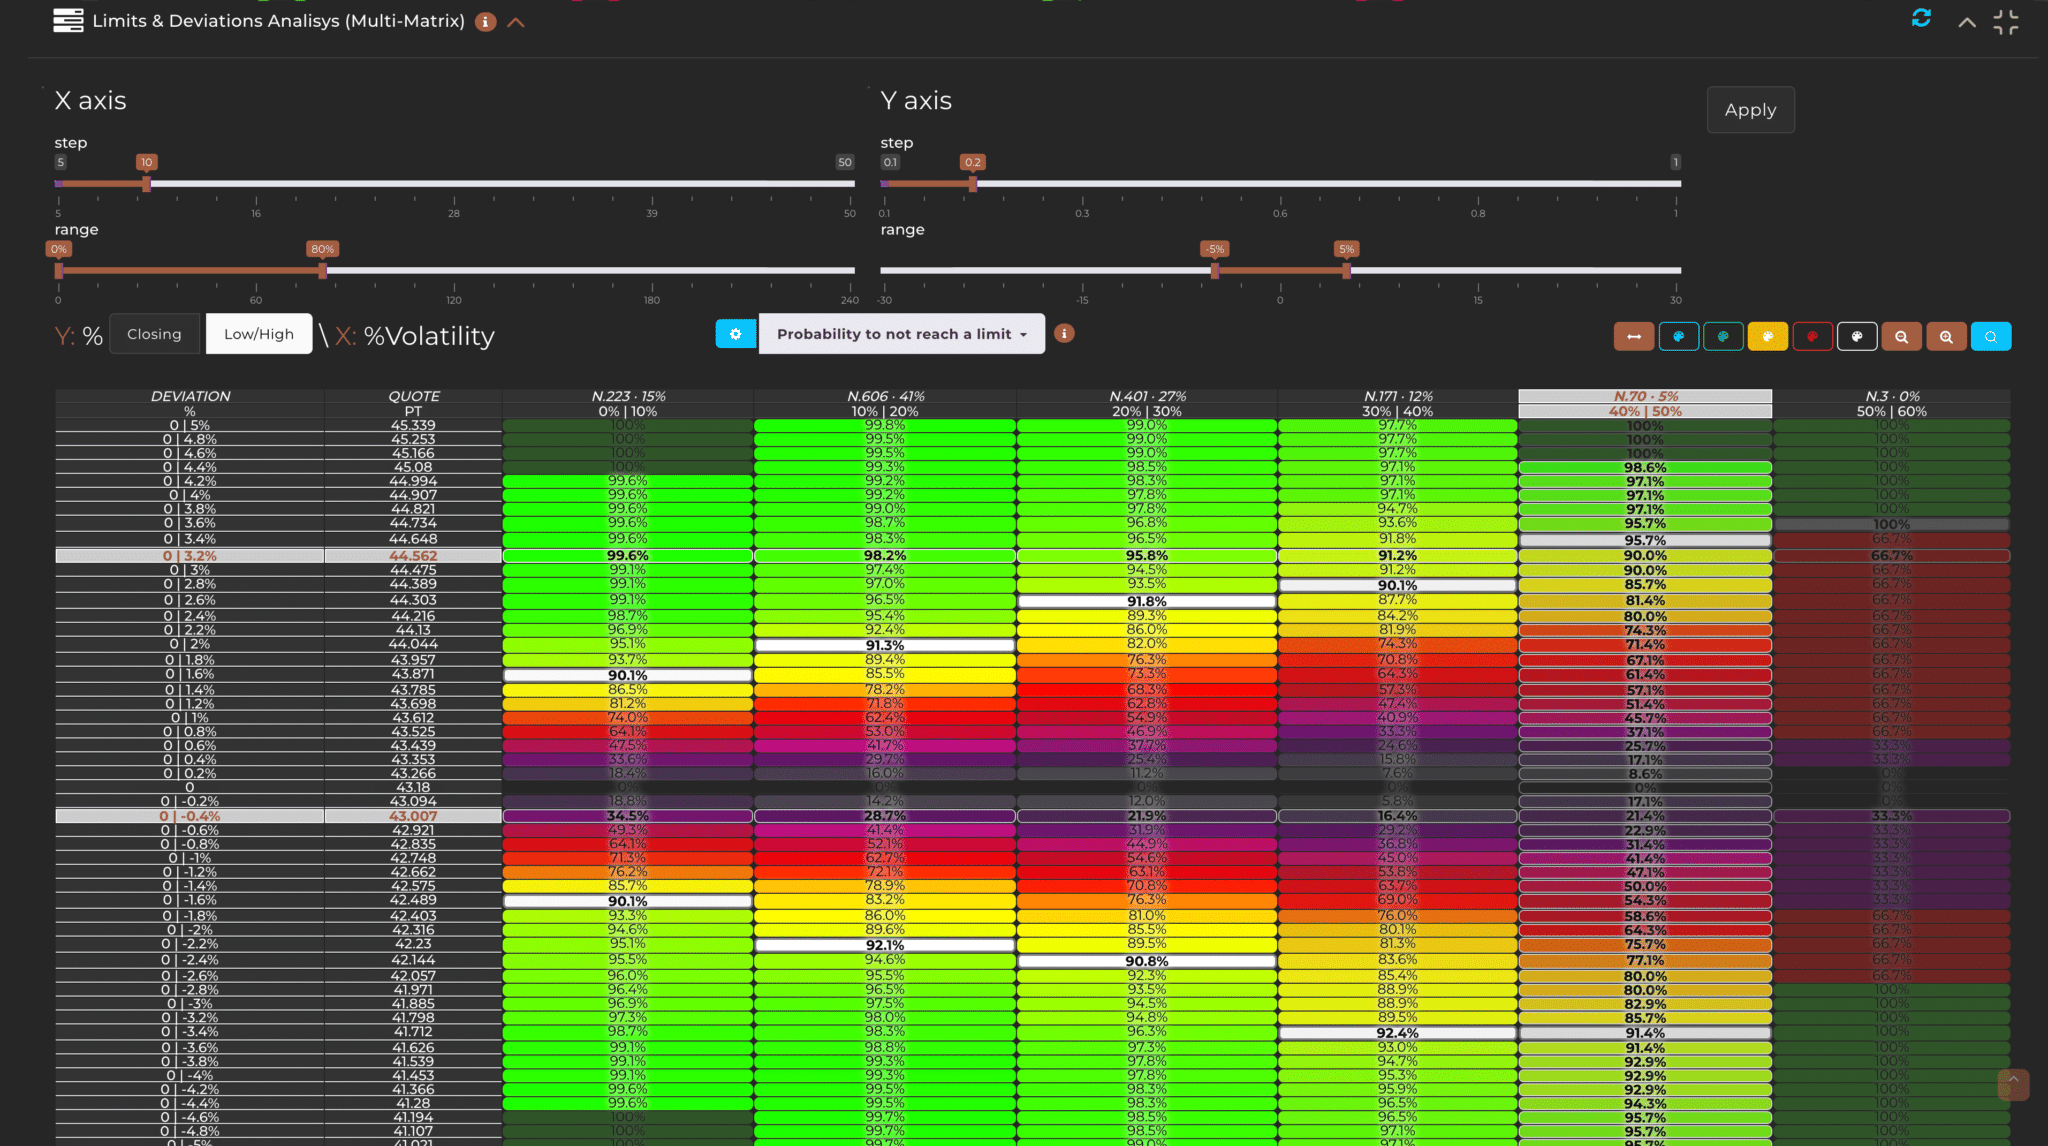
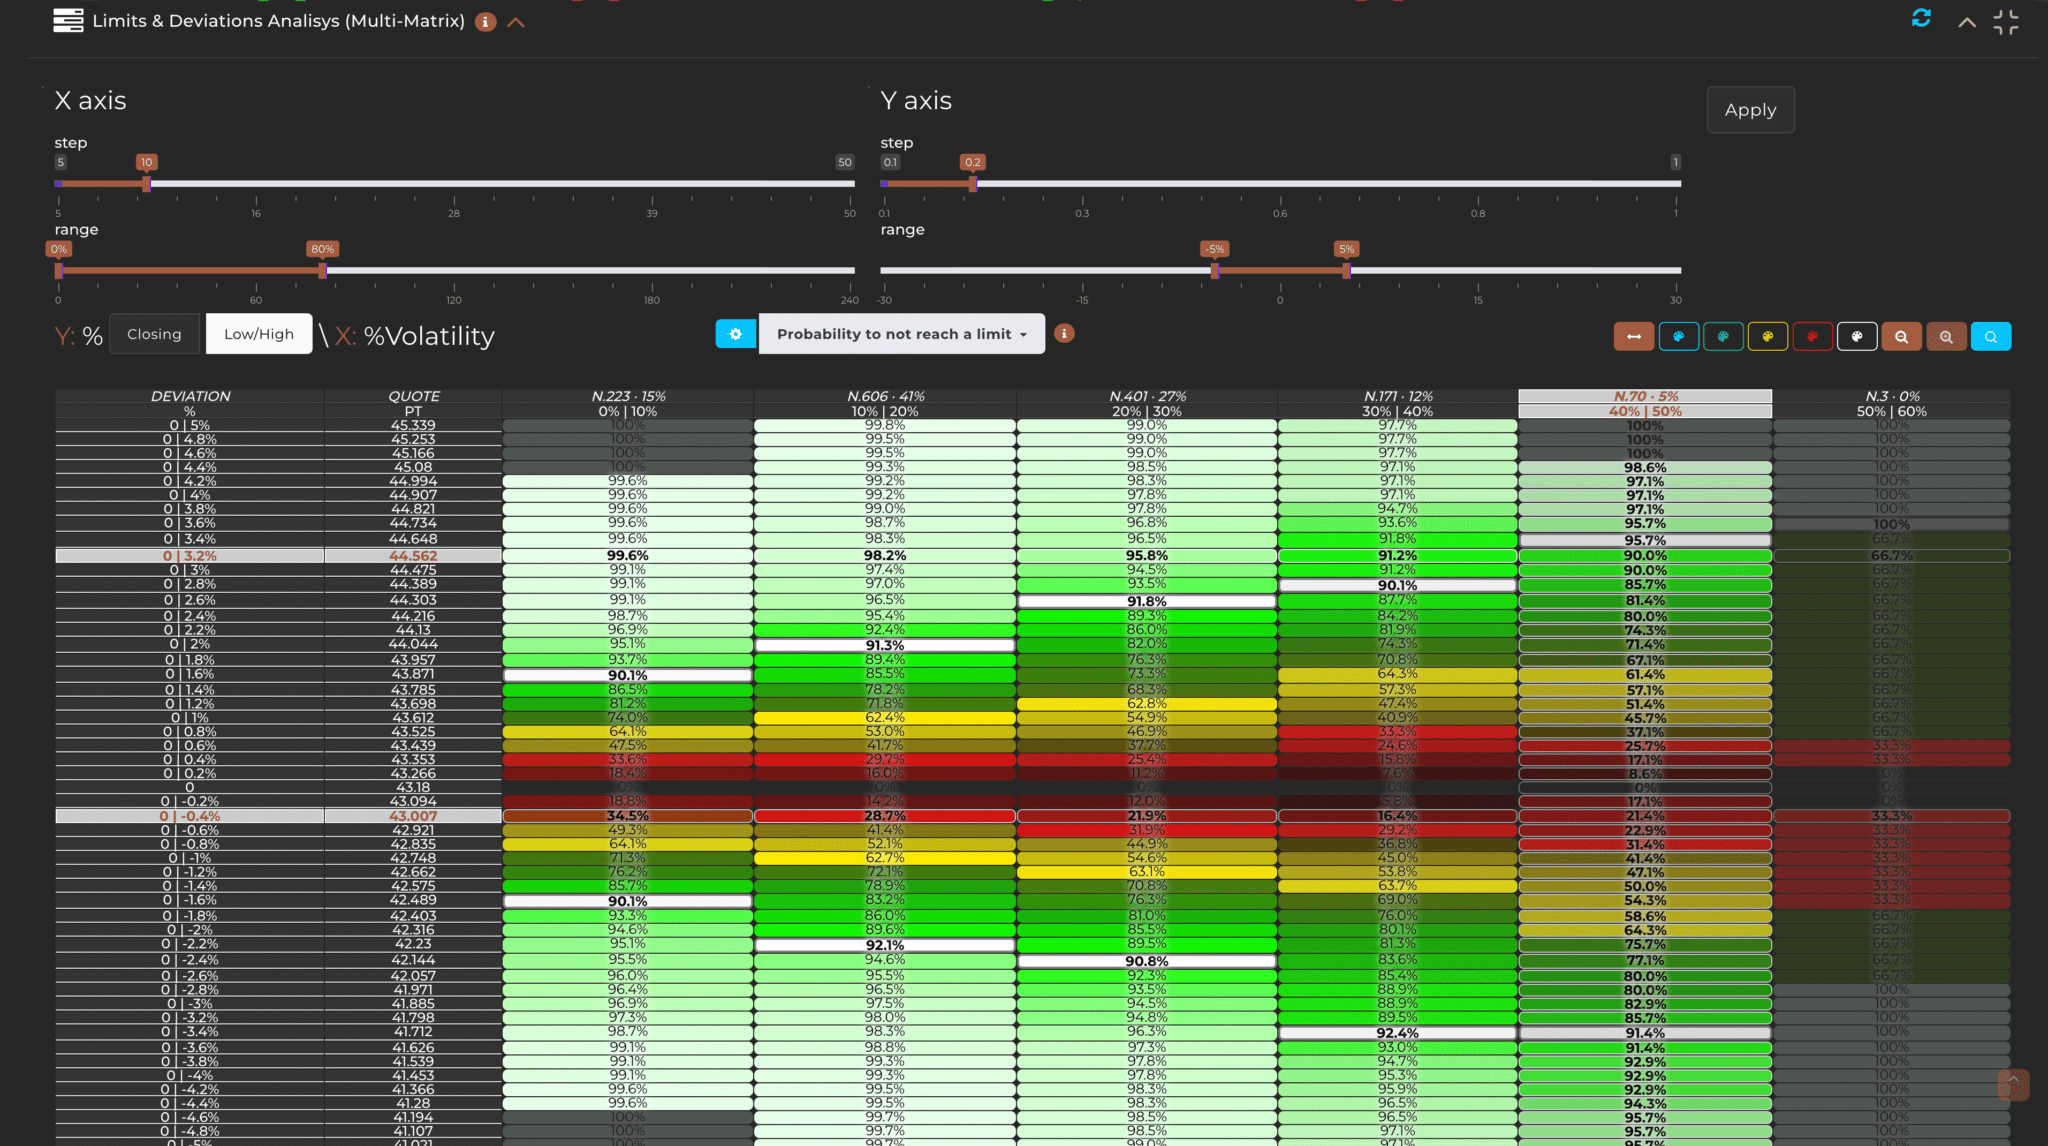
Through specific selectors, you can change the color scheme of the matrix to make the data more legible when the data does not allow for uniform coloring.

Remember, the matrix calculates its results based on the series filtered with the Series filter, so it’s important to keep this aspect in mind. For example, to analyze a complete series, it’s important to reset the main filter, and the matrix will display data for the entire historical series.

