Display the historical price movement, illustrating the range of action of the underlying asset through the representation of maximum, minimum, average, and periodic closing values.
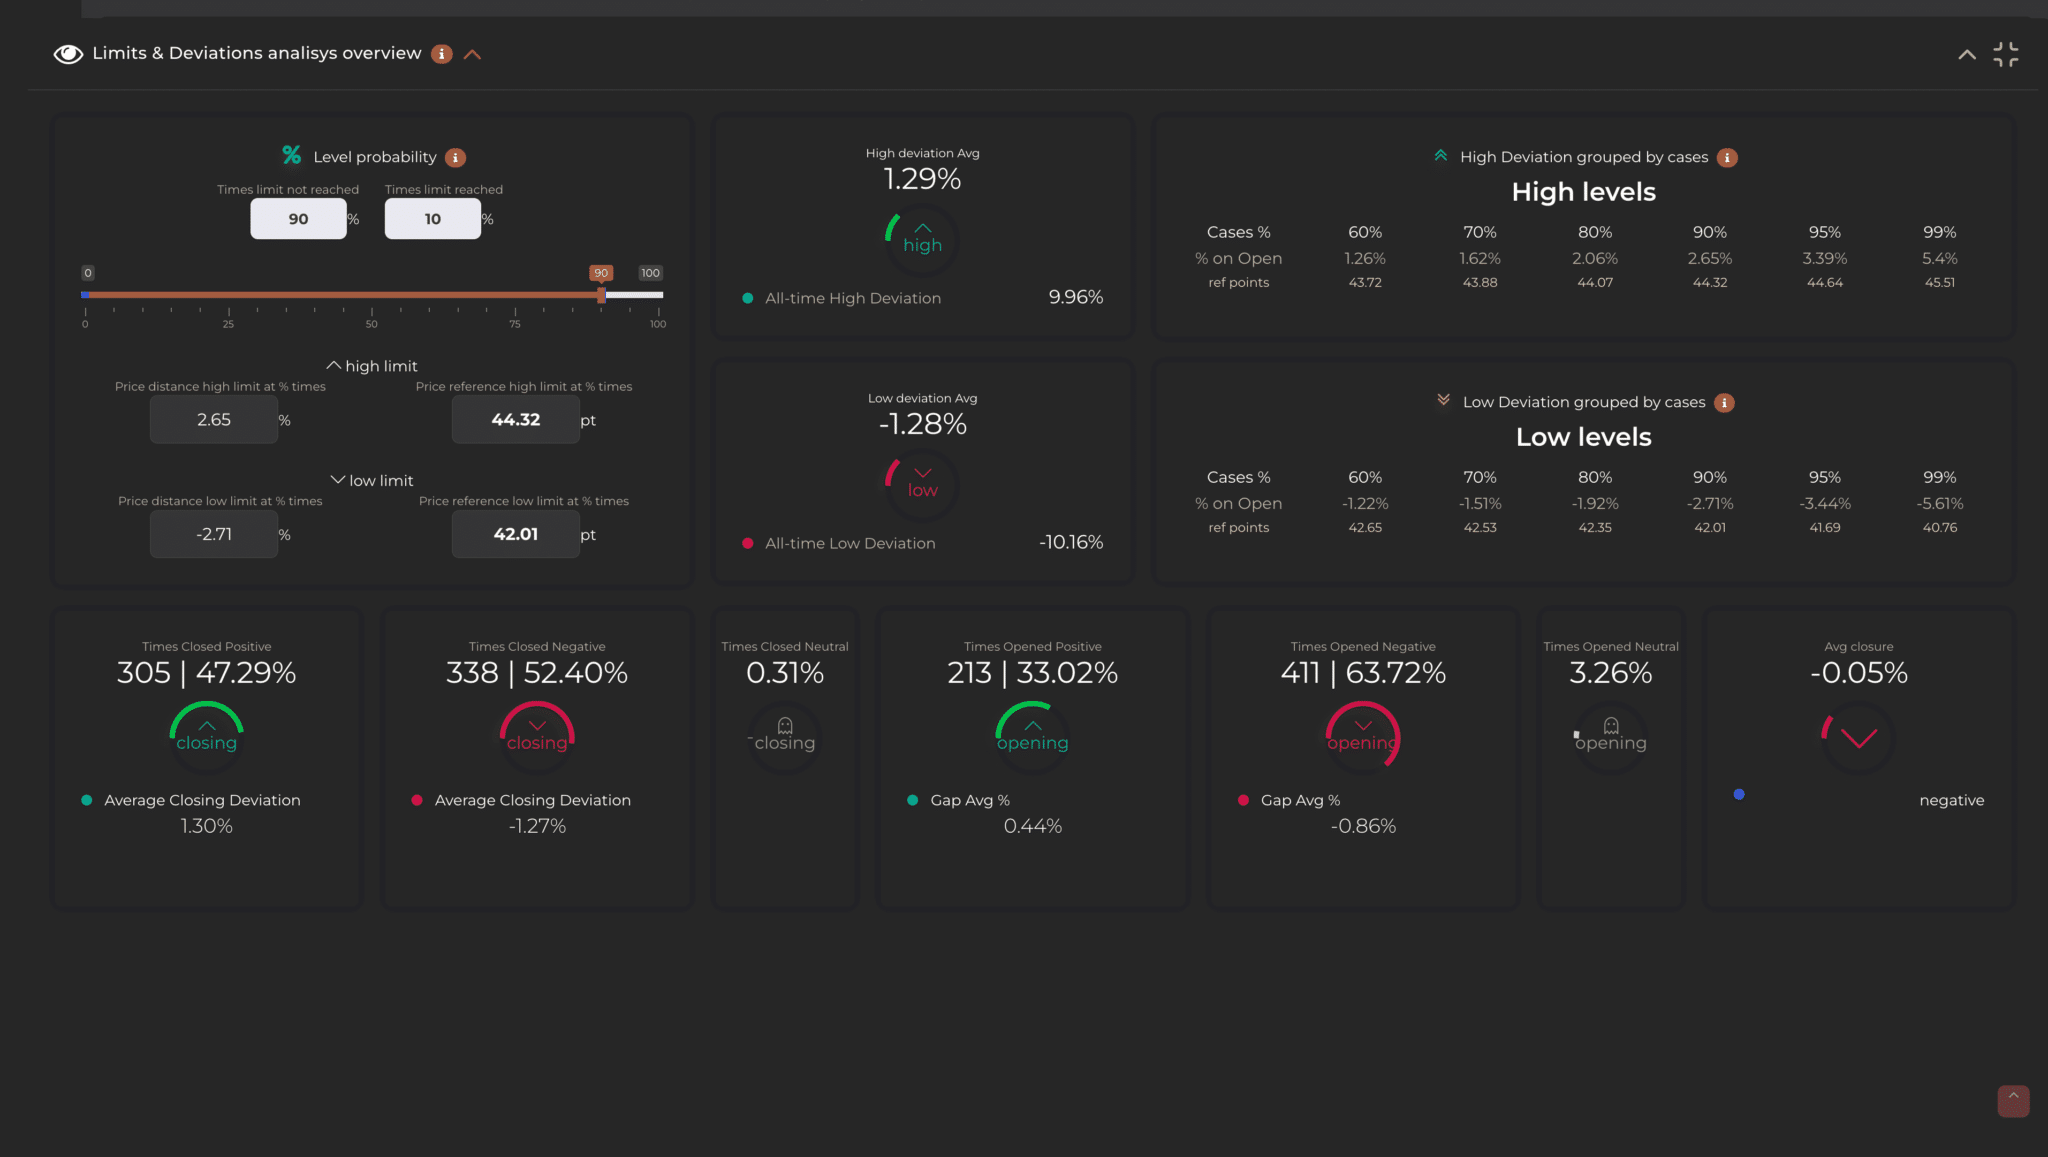
This feature, the Limits & Deviations analysis Overview, displays the overall results of the data filtered in the series, updating them every time a new portion of data is selected. Regardless of whether a part or the entire series is filtered, the results will always be updated.
The dashboard under consideration is designed to outline the ‘domain’ of the underlying asset, a concept that refers to the full range within which the price has moved during the analyzed period. This domain is represented by the extreme price limits, both upper and lower, that the underlying asset has touched or exceeded over the course of the filtered historical series.
In other words, the functionality displays the complete range of price fluctuations, offering an immediate view of the highs and lows that define the range of action, or ‘domain’, of the underlying asset. In addition to this, it is possible to compare these extreme limits with the average closings and openings.
Screenshot
Technical description
Technical Description: The ‘Limits & Deviations Panel’ functionality displays the ‘domain’ of the underlying asset, that is, the full range within which the price has moved during the analyzed period. This domain is represented by the extreme price limits, both upper and lower, and by the upper and lower price averages that the underlying asset has touched or exceeded over the course of the filtered historical series.
It should always be remembered that the data shown are related to the filtered series; to have a general, incontrovertible view of the domain, you should not apply any filter to the series. By applying a filter, you are investigating the historical behavior of the series by applying your own assumptions of similarity in order to obtain more precise answers.
The information provided includes:
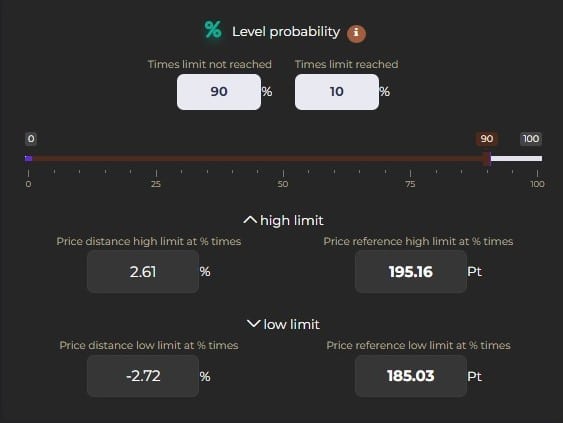
The calculator: determines the historical limits based on the probability of the results that interest us. This tool is composed of several parts: Probability of levels: Calculates the historical highs and lows considering the historical probability of reaching or not reaching a target. For example, it is possible to discover the price levels that, in 90% of the cases, have not been touched in a certain period, or the historical probability of reaching a certain price.
“It is possible to modify the probability levels using a selector or by entering specific values. Once the desired probability percentage for the analysis is chosen, the maximum/minimum limits in percentage and points will be automatically calculated. Maximum/minimum limits in percentage (%): Indicates the percentage deviation from the opening of a specific time interval, within which X% of the historical maximum of the filtered series has not been reached (or has been reached). This varies depending on the goal taken into consideration, whether it is achieved or not. Maximum/minimum limits in points (Pt): Indicates the maximum/minimum percentage deviation converted into price terms, starting from the opening price of a specific time interval.
Extreme limits and the average of maximum/minimum limits: represent the absolute maximum values filtered in the series and the average of all limits which are also subject to filtering. The extreme values of the limits correspond to the maximum or minimum filtered in the series, representing the maximum or minimum historical deviation recorded in the analysis of the series itself. The average of the maximum/minimum limits, on the other hand, represents the average calculation of all the deviations filtered in the series.
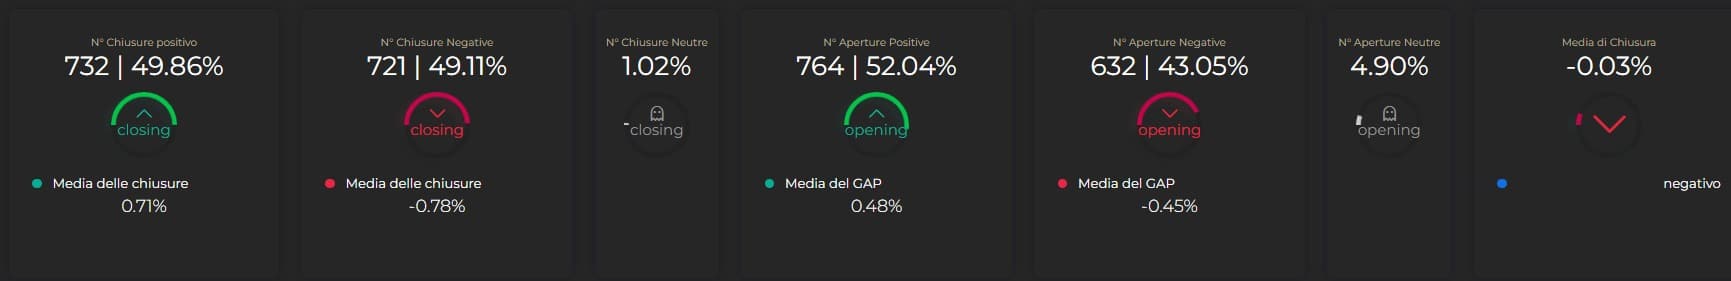
Series counters: Presents the number and percentage of positive, negative, and neutral closings and openings, along with the average of the closings and the GAP, providing a general analysis of the behavior of the filtered series. In the dashboard, we can view the following metrics:
N° Positive Closures and Average Closures
N° of Negative Closures and Average of Closures
N° Neutral Closures
N° Positive Openings and Average of the GAP
N° Negative Openings and Average of the GAP
N° Neutral Openings
Average Closing in general of the entire filtered series: The overall average of closings, which represents the basic trend of the series.
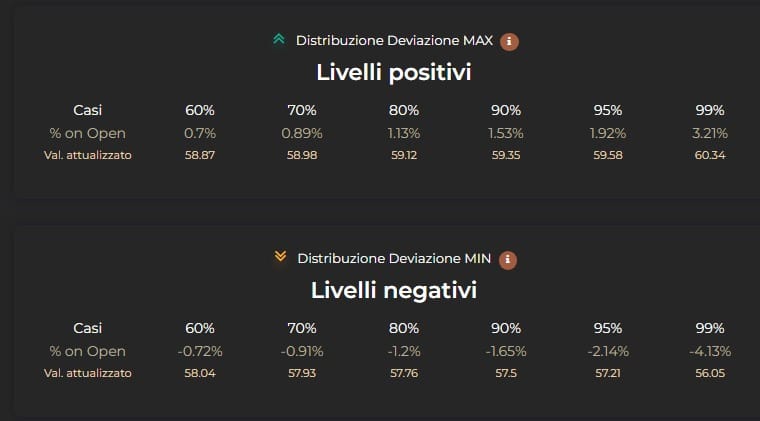
Limit levels: which represent the deviations necessary to exceed a certain quantity of the filtered candles. These measures offer a percentage representation of the situations in which the price of the underlying asset has shown maximum or minimum variations. Both the frequency of the variations in percentage and the specific amount of such variations are provided, expressed both as a percentage and in points or monetary terms.
For example, for an index like the SPX, it might be indicated that in 60% of the cases, a maximum variation of 0.47% at the opening was recorded, which is currently equivalent to 450 points.
Google Analytics is a web analytics service provided by Google Ireland Limited ("Google"). Google uses the collected personal data to track and examine the usage of this website, compile reports on its activities, and share them with other Google services. Google may use your personal data to contextualize and personalize the ads of its advertising network. This integration of Google Analytics anonymizes your IP address. The data sent is collected for the purposes of personalizing the experience and statistical tracking. You can find more information on the "More information on Google's handling of personal information" page.
YouTube is a video content visualisation service provided by Google Ireland Limited. This service allows this Website to incorporate content of this kind on its pages. This widget is set up in a way that ensures that YouTube will not store information and cookies about Users on this Website unless they play the video.
Facebook Remarketing is a Remarketing and Behavioral Targeting service provided by Facebook Ireland Ltd. This service is used to link the activity of this website with the Facebook advertising network.
Google Ads conversion tracking is an analytics service provided by Google Inc. that is used to connect data from the Google Ads advertising network with actions performed on this Site.