Our Historical Series Filter is a powerful magnifying glass on the market.
It uses an advanced statistical approach to analyze the historical price series based on Japanese candlesticks
This tool allows you to filter through a series of metrics such as volatility, the type of opening, specific days, opening gaps, and candlestick patterns.

The foundation of all this is inferential statistics, which allows you to make inferences about the general market trend based on observed data.
Whether you want to emulate the current market conditions or research a specific condition, this filter is designed to provide a clear and detailed view of historical trends, helping you make more informed trading decisions.
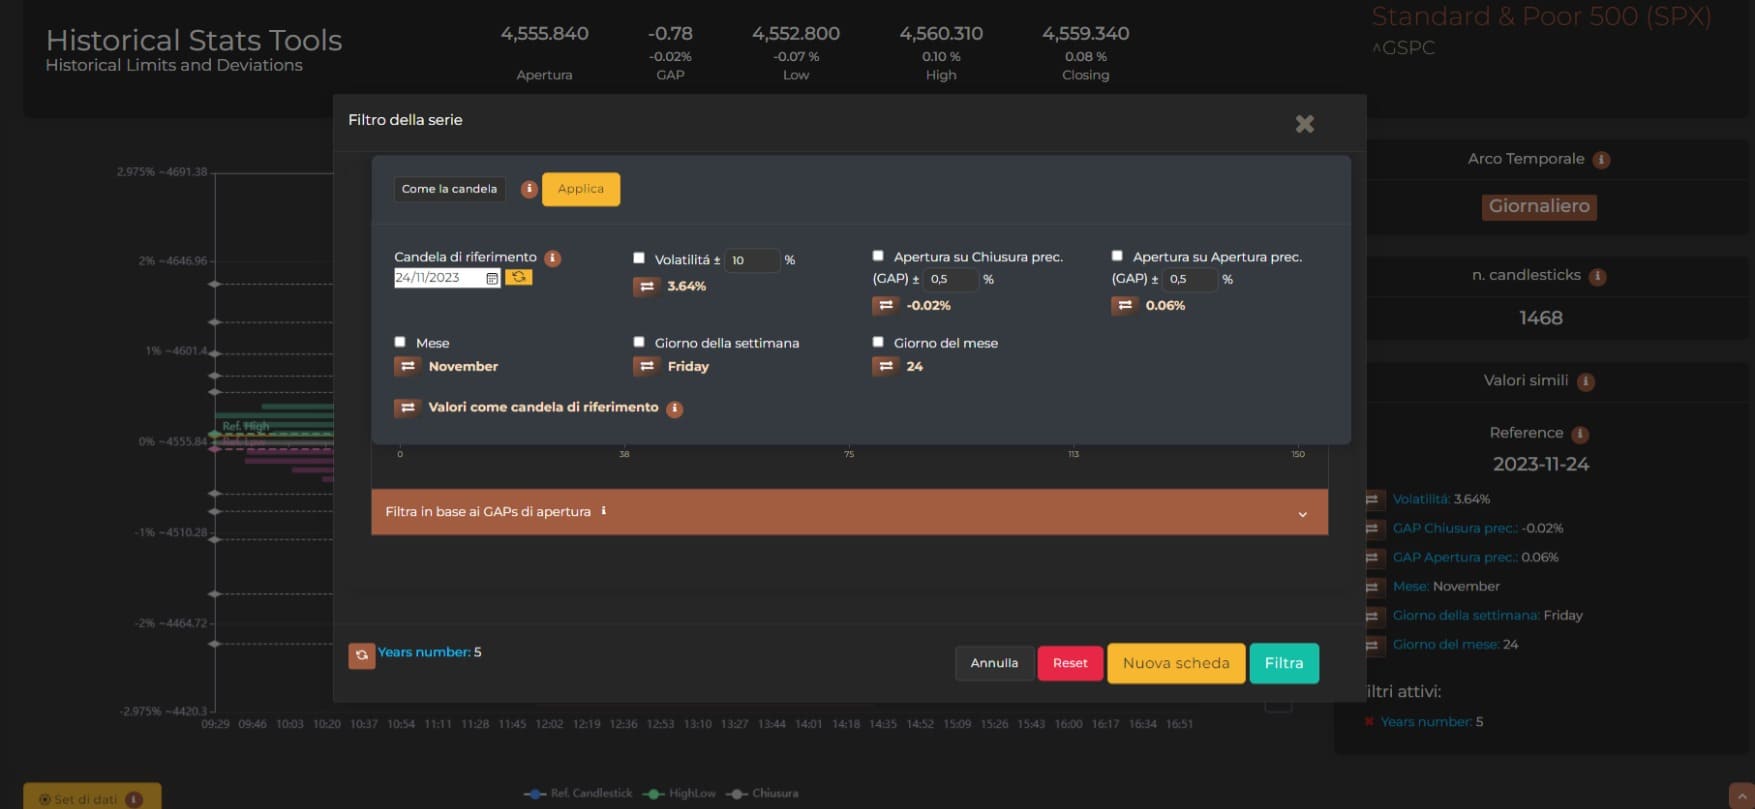
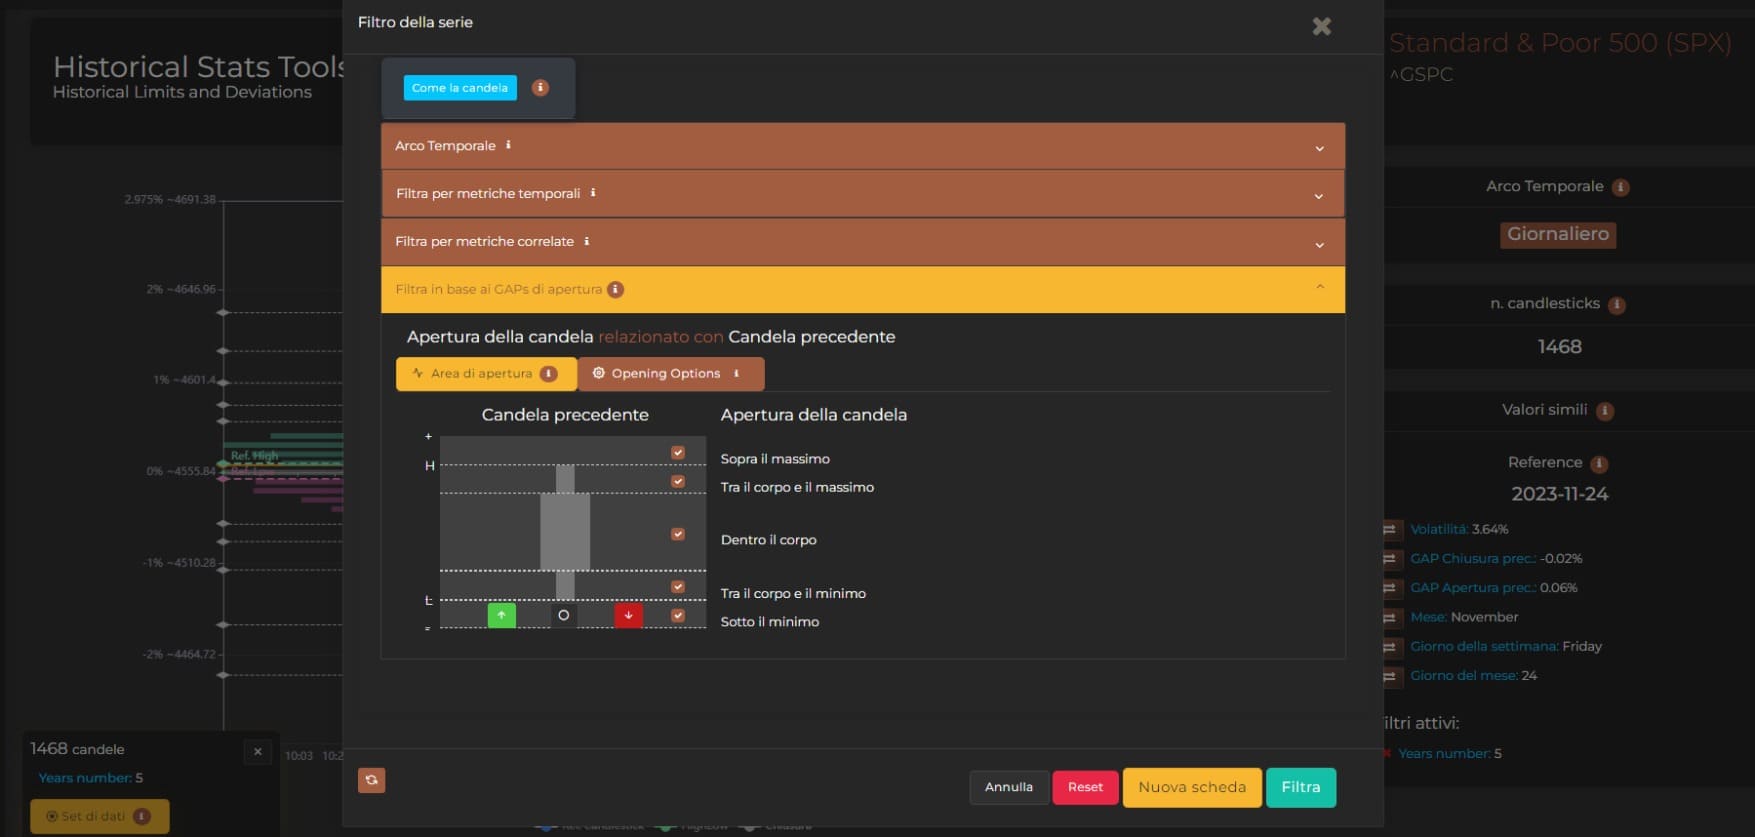
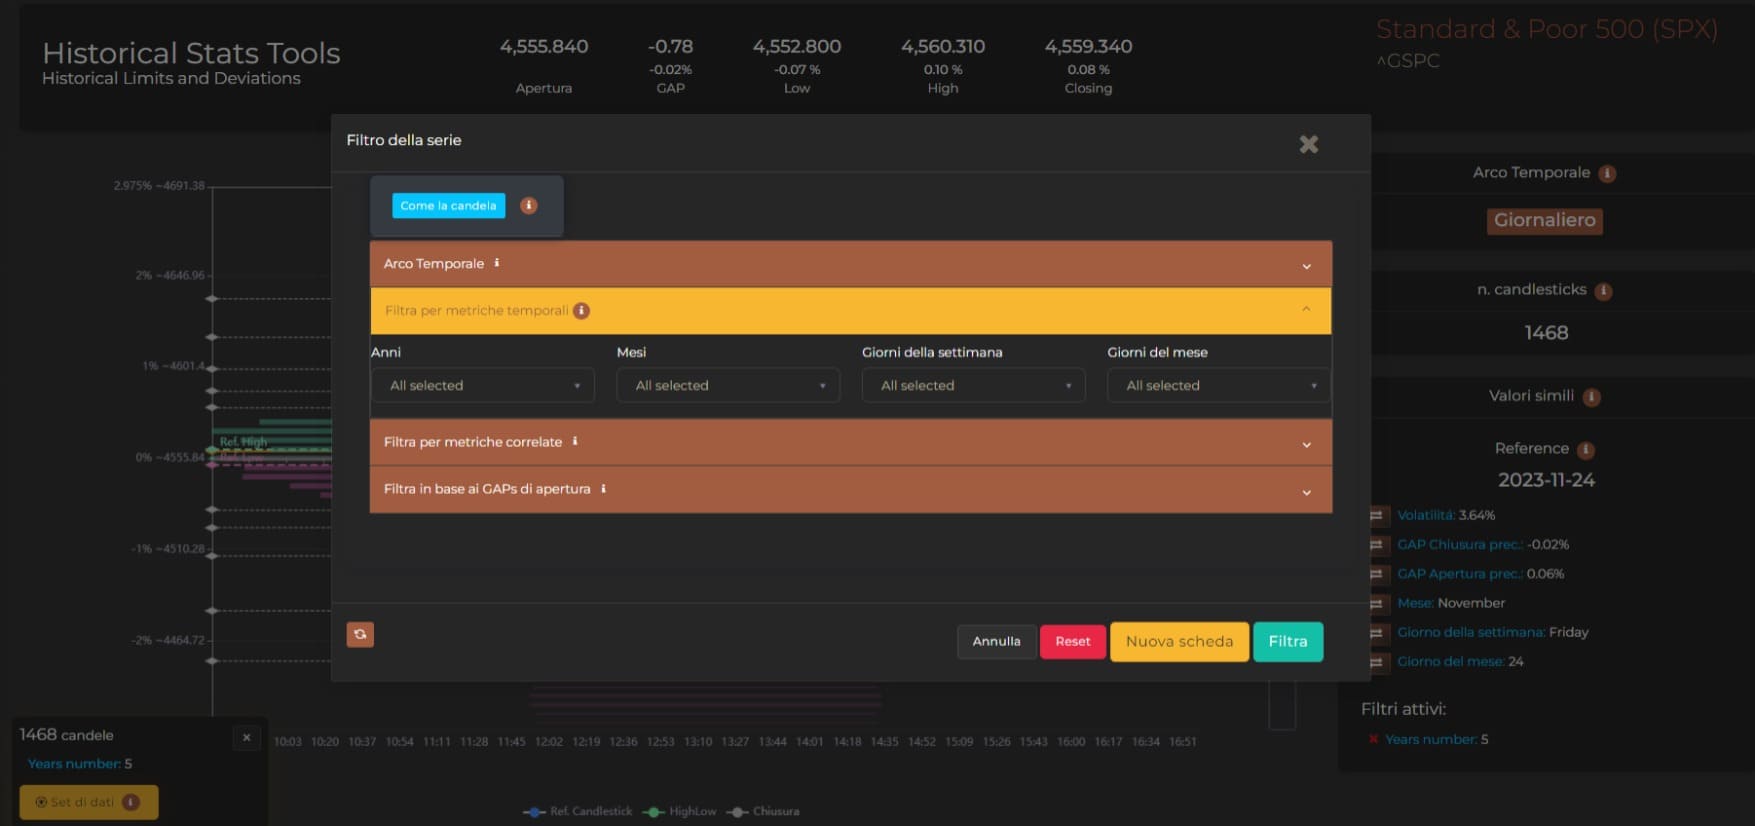
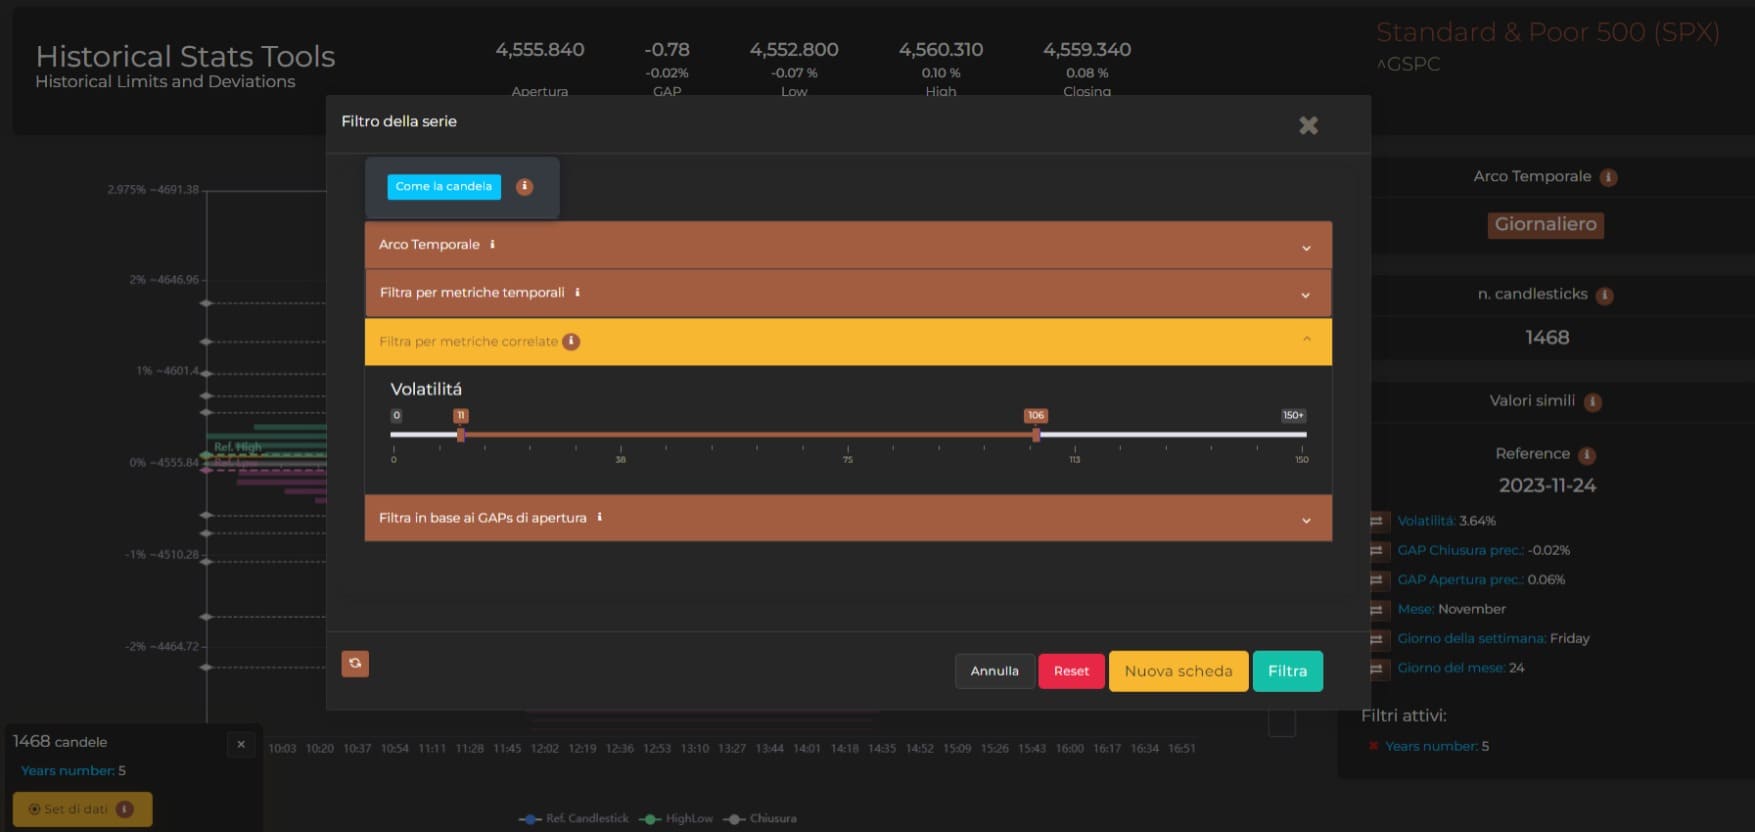
Tool to filter the historical price series (Japanese candles) through the selection of one or more metrics such as volatility, the type of opening, specific days or months, opening gaps, candlestick patterns, etc…
One of the secrets of MetricAlgo is the statistical approach it allows you to use, which would probably be impossible for you to achieve on your own. For this reason, the Series Filter is extremely central and important in our analysis. Before describing this tool to you, it’s important to understand what “inferential” statistics is so that you can truly appreciate the value of this feature, which will allow you to conduct many types of analysis. Inferential statistics is a branch of statistics that deals with using observed data to make inferences about the population from which they come. In other words, inferential statistics is the process of generalizing the results obtained from a sample to the population from which the sample was drawn. Inferential statistics is an important tool in many disciplines, including scientific research, medicine, economics, and finance. For example, inferential statistics is used to:
Inferential statistics is based on a two-step process: Data Collection and Data Analysis, while “making an inference” means drawing a conclusion from a set of data or information. In statistics, inference is the process of generalizing the results obtained from a sample to the population from which the sample was drawn.
Here are some examples of inferences:
Inferences can be made deductively or inductively. Deductive inferences are those where the conclusion is inevitable from the premises. For example, the conclusion ‘the fields will be wet’ is inevitable from the premise ‘it rains’. Inductive inferences are those where the conclusion is probable, but not inevitable, from the premises. For example, the conclusion ‘the patient might have malaria’ is probable, but not inevitable, from the premise ‘the patient has a high fever’. The results of MetricAlgo are inductive inferences and therefore aim to identify the probability fields that a certain event will occur based on the past.
Inferences are an important process in scientific research and in everyday life. They allow us to learn from the past and make predictions about the future. However, inferences are true statistical advantages for the trader who knows how to find them, and the use of this Filter is designed as a tool for the researcher.
Let’s delve into the details of how it works; defining the correct parts in our context:
The population under examination: the sequence of price candles, referred to as the ‘historical series’.
Observed data: For example, all Thursday candles in the months of August where volatility is between 30% and 35%, and the opening gap is positive. Let’s imagine that the market is in this condition today, and we would like to know how it generally behaved in the past. The Filter is used to find these ‘observations’.
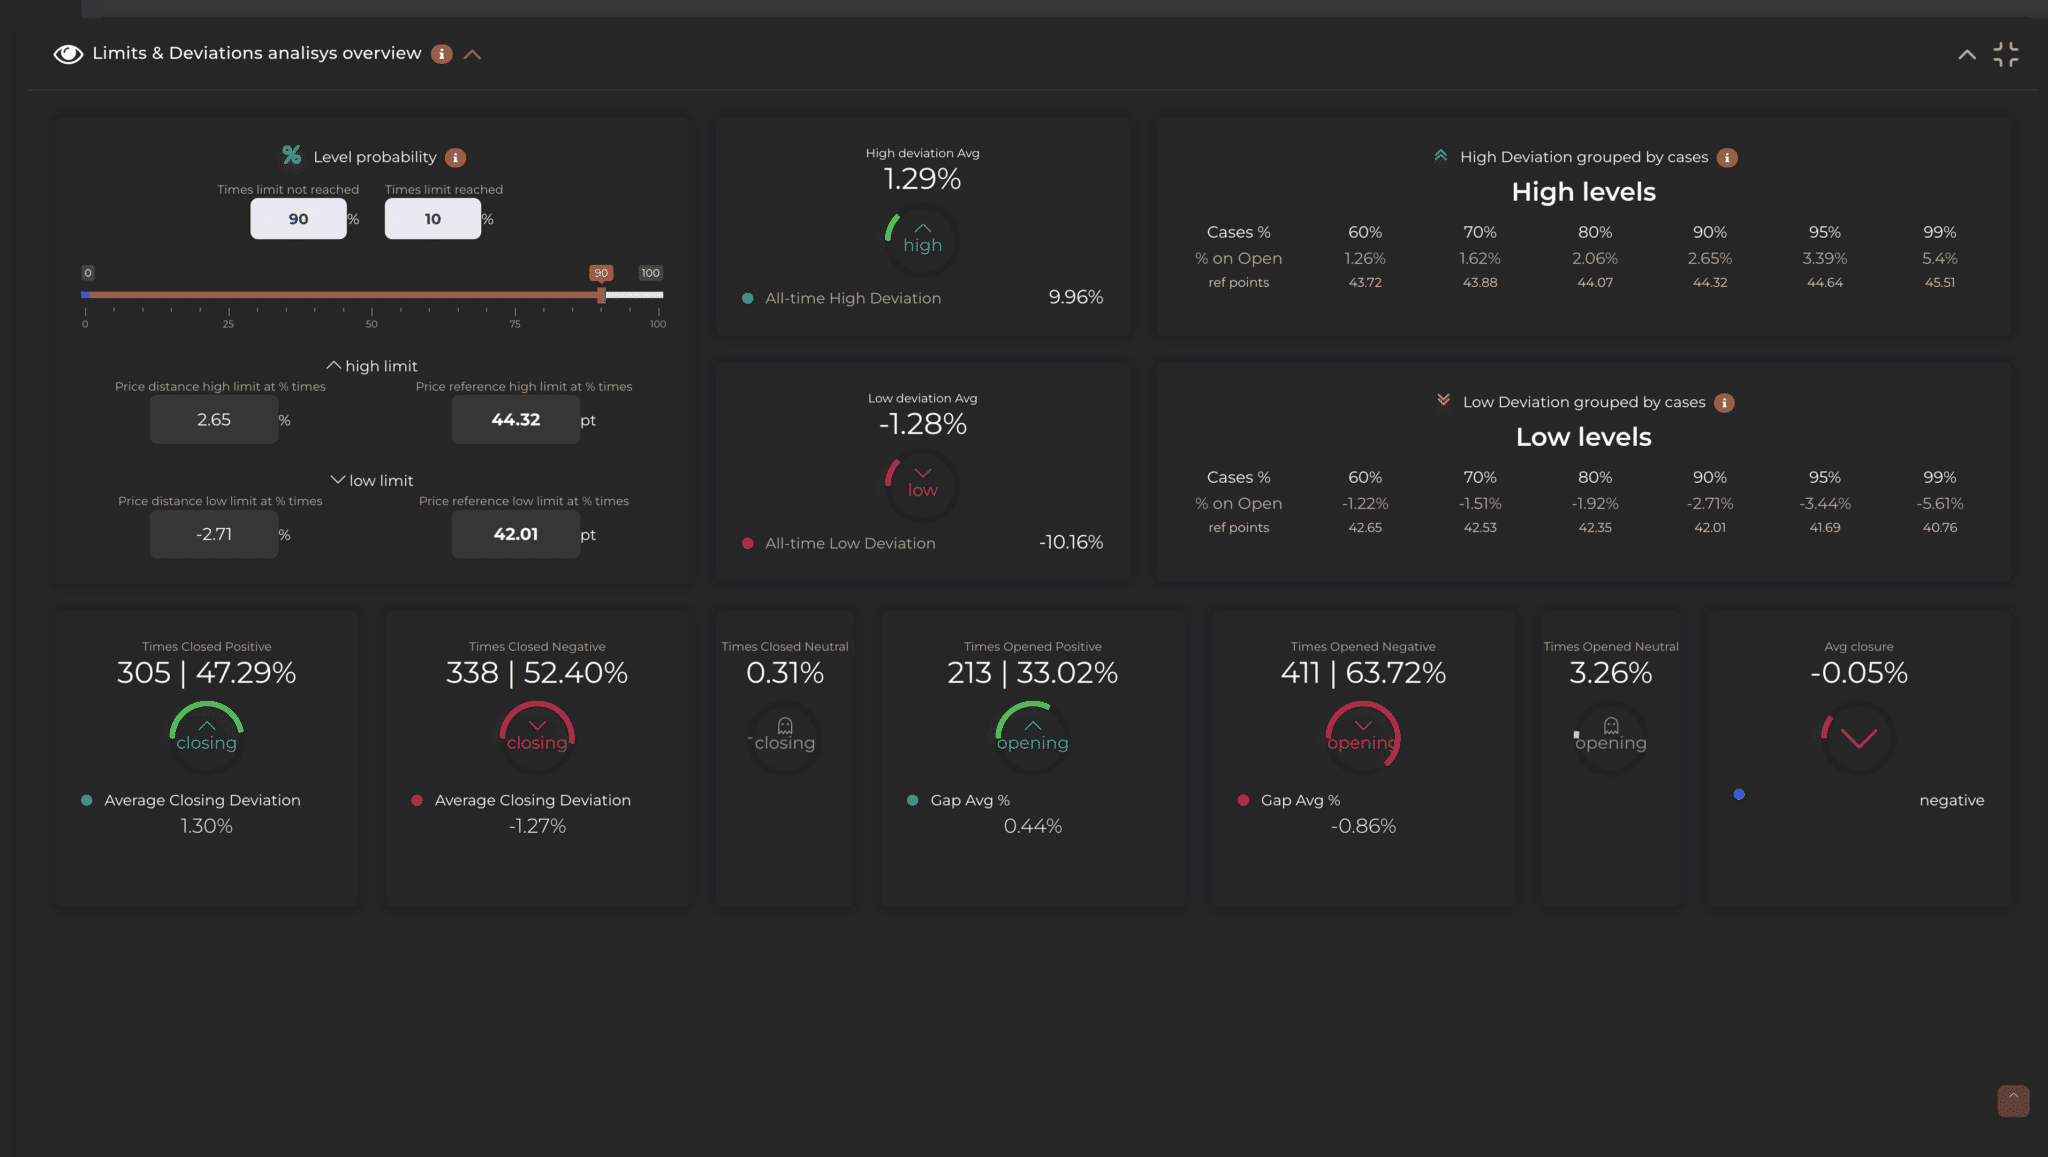
Data analysis: These filtrations allow us to obtain results, such as the probability of gaining by buying in this condition or selling under those conditions. Or the drawdown, annual return, etc… all results that, in turn, can be more or less of statistical advantages.
The more metrics we use in this filter, the smaller the population under examination (dataset) becomes, and the less effective the resulting statistics are. Conversely, for example, similarities with the current market condition can tell us what the historical probabilities are of reaching a certain price level.
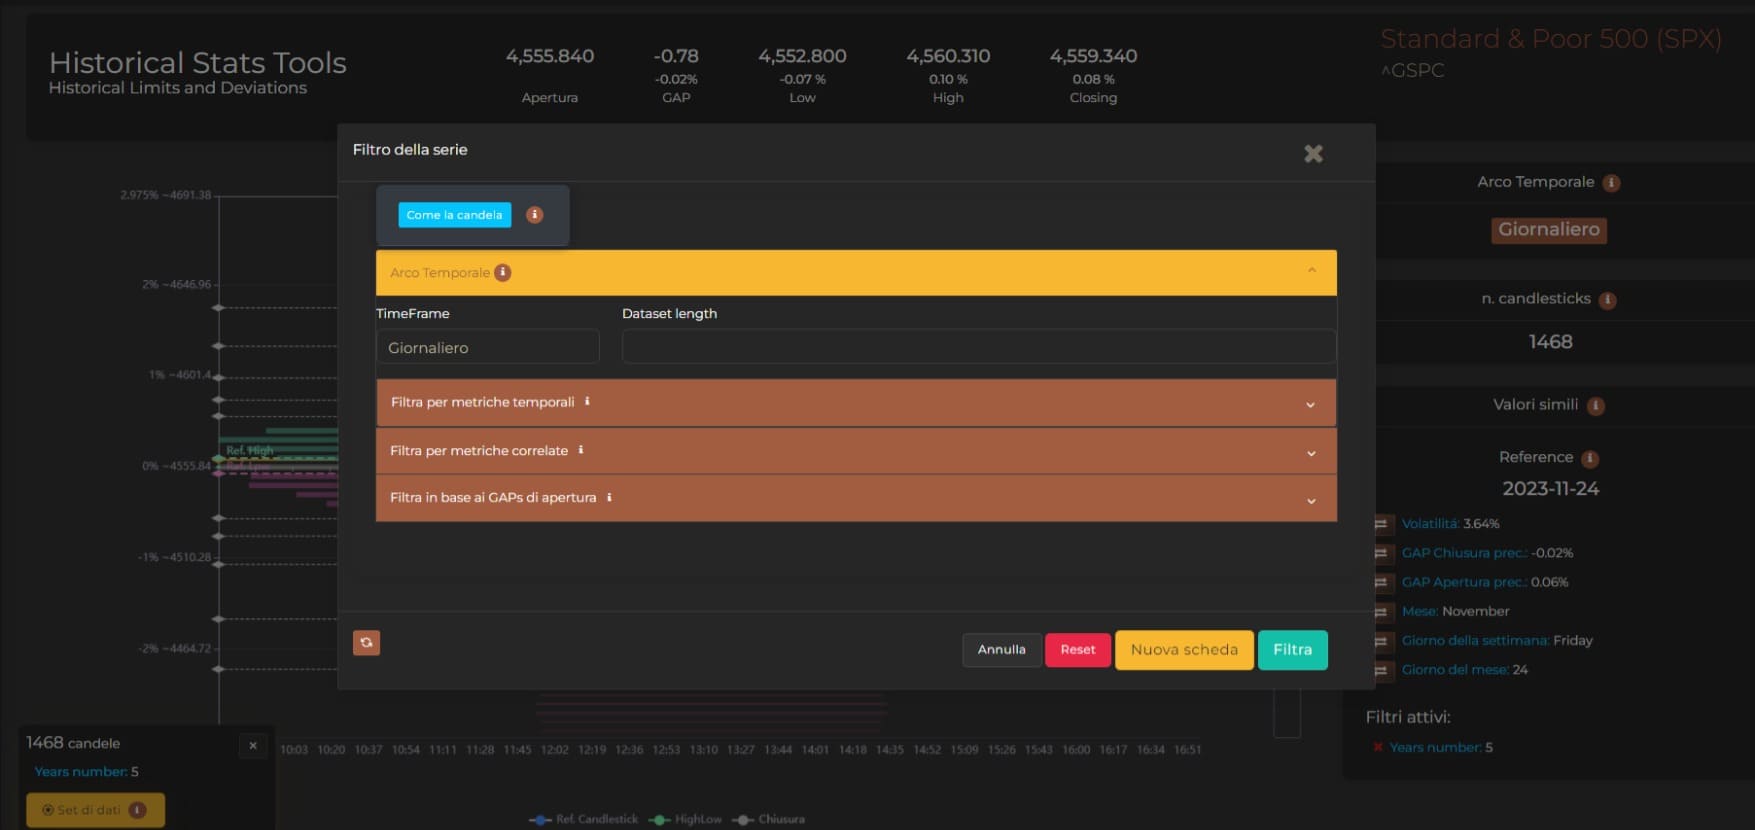
We then apply these concepts to what we do with MetricAlgo and understand why this filtering tool is essential for those looking for a statistical edge on a particular stock. Let’s now look at the main components of this tool to understand how it’s possible to filter a historical series:
The first distinction to make is the “reason” why I’m trying to filter the series, which are mainly two:
Although there is no technical difference between the two motivations, in terms of usage, we have made life easier for the researcher by adding the “LIKE NOW” button. This button simply resets the filter by “reading” the current situation and automatically setting the filter for you with conditions most similar to today. However, it is possible to conduct “manual” searches by setting the main filters which are:
It’s important to clarify that, although it’s not correct to generalize, it’s not advisable to use statistical results as valid if the dataset under consideration has less than 30 elements, or if the population under study is fewer than 30. It’s very important to know that statistics are always stronger with a higher number of samples For this reason, the number of elements on which the analysis is based is always indicated.

Privacy Settings
This website uses cookies to improve your experience while you navigate through the website.
