Explore the advanced features of the limits and deviations analysis page on MetricAlgo This article will guide you through its key components, helping you to make the most of this tool for your trading strategies.
This unique chart displays the values of the filtered candles and the trend of the reference candle, providing a detailed view of historical probabilities and deviations.

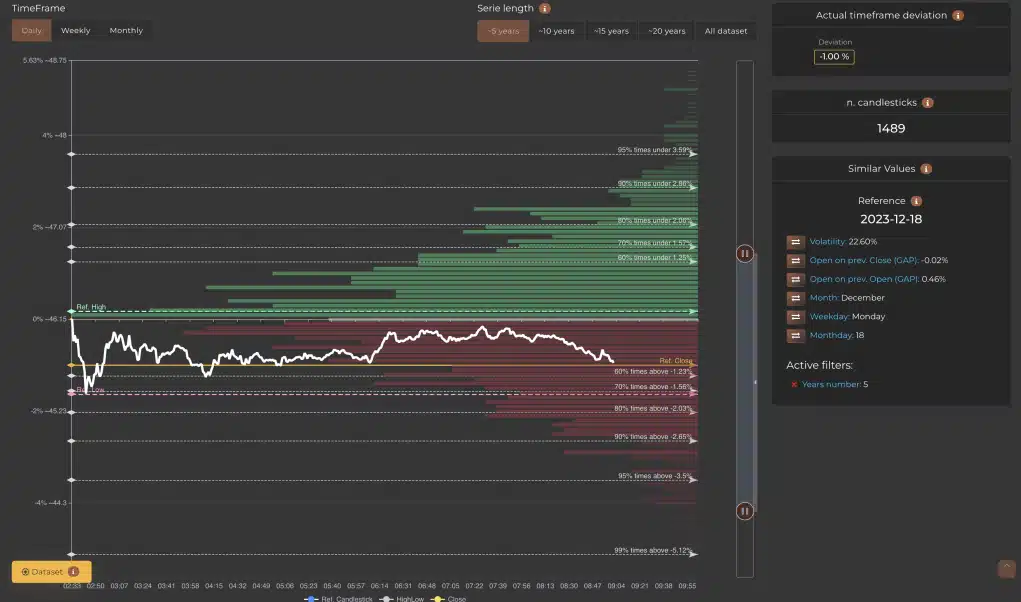
The Y-axis of the graph starts from the opening value of the period (indicated as “0”) and extends both in positive and negative deviations. This allows for easy visualization of the percentage changes relative to the opening price.

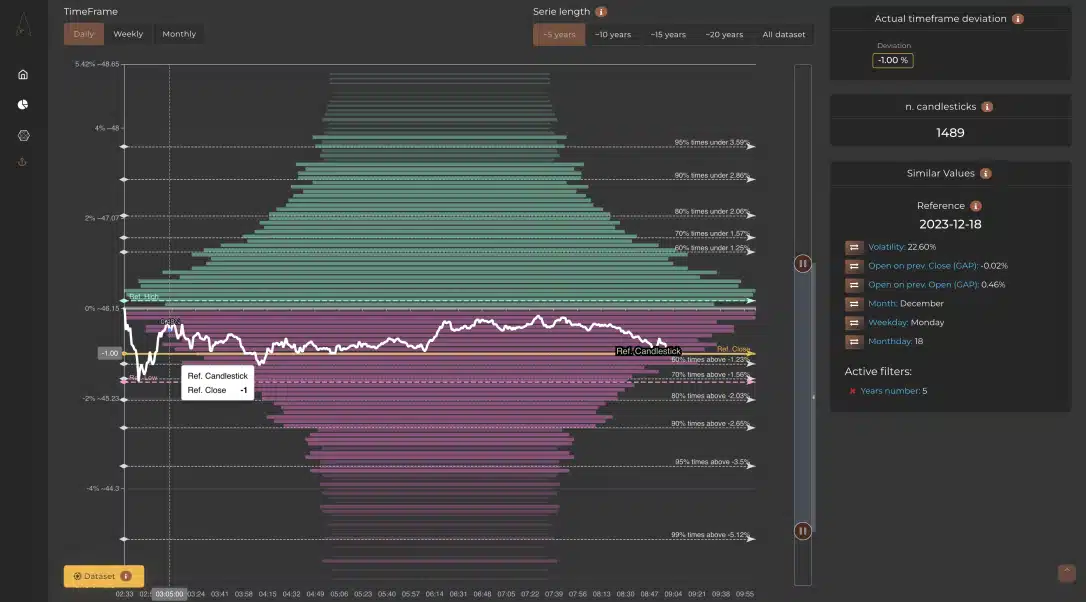
The X-axis represents the time period, updating in real-time the behavior of the last candle. The dotted green, fuchsia, and yellow lines represent the maximum, minimum, and current values of the reference candle, respectively.

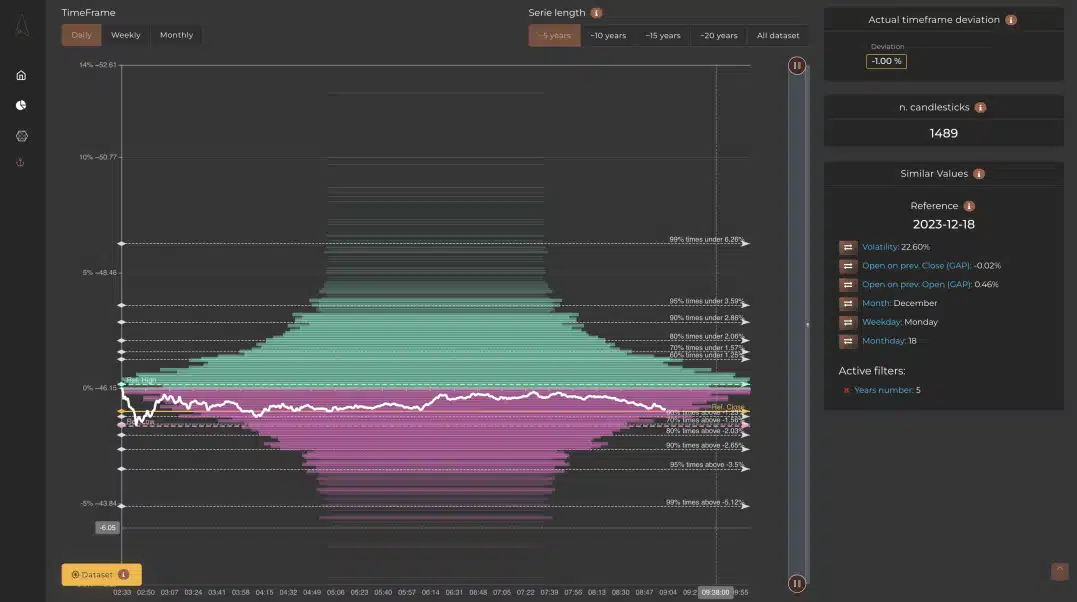
These lines indicate the frequency with which a high or low has occurred at a certain level. Their length and thickness represent the frequency of events, providing a quick understanding of their rarity or frequency.
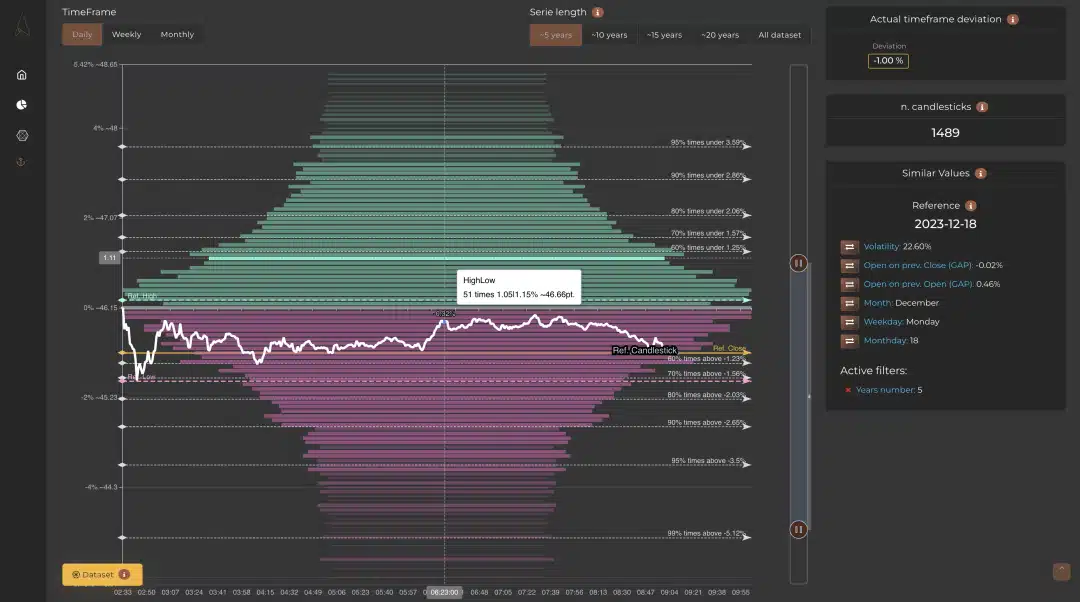
By expanding the right bar, you can view the entire range of limits reached. Hovering the mouse over the colored lines will display a tooltip with details on the number of times a given maximum or minimum has been recorded.
These lines represent the percentage of candles that have not reached a certain deviation level, providing a global and statistical view of the historical series.
Changing the timeframe or the length of the historical series does not alter the fundamental behavior of the chart, except by adding or removing cases from the view. Even the application of filters simply modifies the cases displayed.
The limits and deviations analysis page on MetricAlgo offers a deep and intuitive view of the historical price behavior. By using these tools, you can significantly improve your ability to predict and react to market trends.

Privacy Settings
This website uses cookies to improve your experience while you navigate through the website.
