Services

One method, three tools.

MetricAlgo is the company; these are the products. The tool changes, the method does not: count first, then decide.

MetricAlgo Options

Live

The library of options systems.

Thousands of options systems already calculated on the history of US markets. You explore them, size them on your capital and get a notification when the conditions appear.
  • Weekly and monthly systems, on indices and single stocks
  • Every system with its numbers, worst periods included
  • Sizing on your capital and real-time notifications
Start free with Options
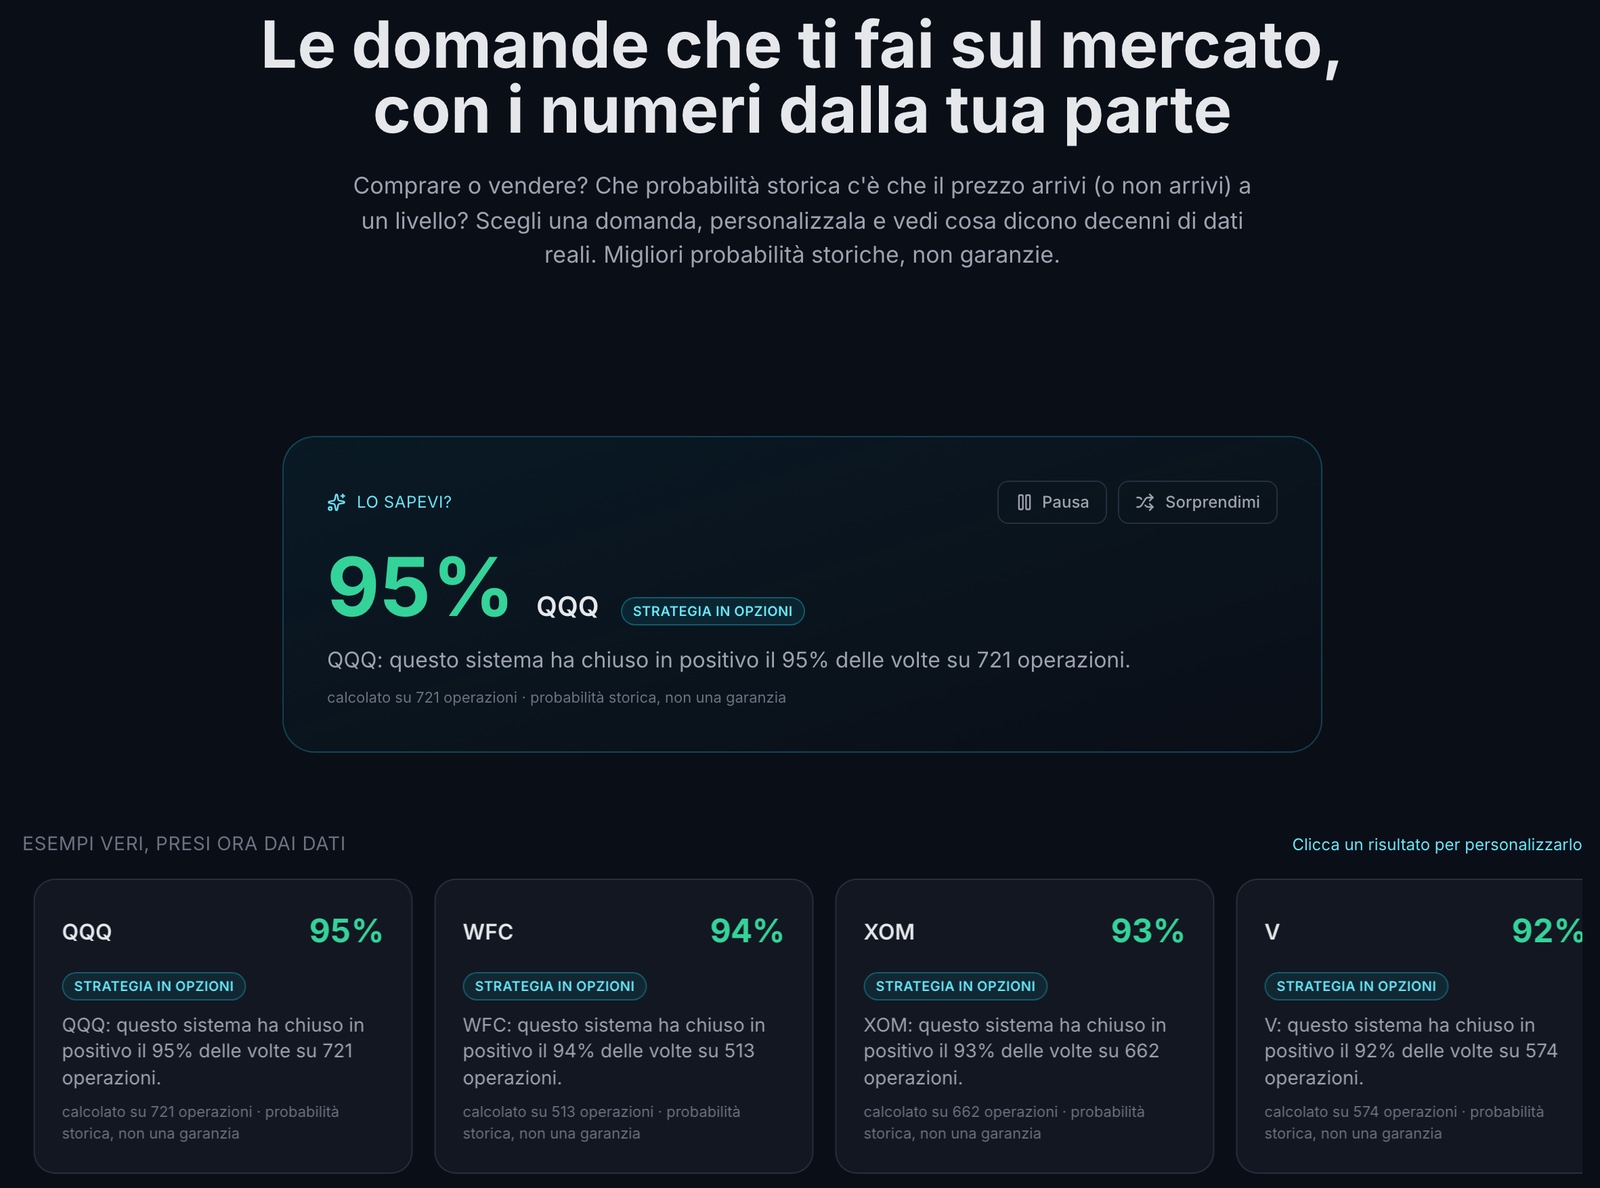
The MetricAlgo Opportunities page: a system on QQQ that closed in profit 95% of the time over 721 trades.
Opportunities: the question at the top, the answer in numbers, always with the number of trades next to it.

Try it now

Pick a probability, look at a real system.

One of the systems in the Options library, with its numbers and its full card.

Show me a system that closed in profit about

470 systems in this band, out of 13,102 published

SPY SPDR S&P 500 ETF Trust

Sell Put

See it free inside MetricAlgo
Trades closed in profit
97.9%
Total trades
240
Largest fall from a peak
9.2%
Gains to losses ratio
5.38
Period measured
2010 – 2026
Cumulative resultResult per period

The chart shows the shape of the run, not the amounts: both series are brought to a common scale. Trade-by-trade figures live inside the platform.

Results are historical and do not guarantee future results. The period each backtest covers is shown next to its figures.

Historical Stats Tools

Live

A market’s statistics, read with your own eyes.

Filter a market’s history, measure limits and frequencies, and see where today’s price sits compared with similar phases of the past. For people who want to ask the data their own questions.
  • Filters on the historical series
  • Historical limits and frequencies
  • Today’s price compared with similar past phases
Discover HST
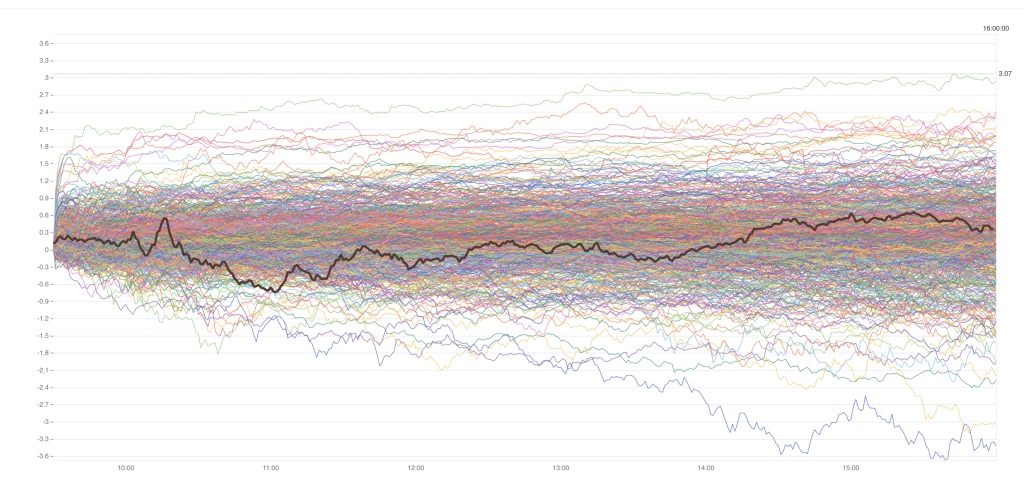
An HST chart: hundreds of past sessions overlaid, with the current session highlighted.
Today’s session, in black, over hundreds of past sessions.

Try it now

Ask the price history a question.

The questions HST helps you dig into, answered from decades of data.

Pick a question

Period

Does SPY close up or down more often?

Since 1993, SPY closed higher in 55% of weeks: 968 of 1,759.

up · 55%down · 45%

The typical move between the open and the close of a week is 1.2%.

Historical probabilities measured on past data, not a guarantee about the future.

Source: the daily price series HST uses, grouped into weeks and months. Price series updated to 9 October 2026.

MetricAlgo Direct

Coming soon

From research to execution.

The bridge between what you measured and what you do, to shorten the distance between the system and the trade. It will use the same free account as Options: sign up today and you are already in when it arrives.

  • The same account as MetricAlgo Options
  • No cost to sign up
Create the free account

One account, every product.

The free plan is the common base: you sign up once and get into the platform.