Phase 1 of 3 · Choose
Choose: the library of systems already calculated.
This is where every system we have calculated lives: 13,102 published, on 20 US markets, each with its own history trade by trade. It is not a list to read from start to finish: it is a warehouse to narrow down until only what you are looking for is left.
Why you start here
You do not have to invent a strategy or know how to code: we have already tested the combinations on years of history. Your job in this phase is just one, choosing. You look at the numbers, compare, read the uncomfortable parts too and set aside the systems that convince you.
01 Screener
The Screener: the whole catalogue, four ways to look at it.
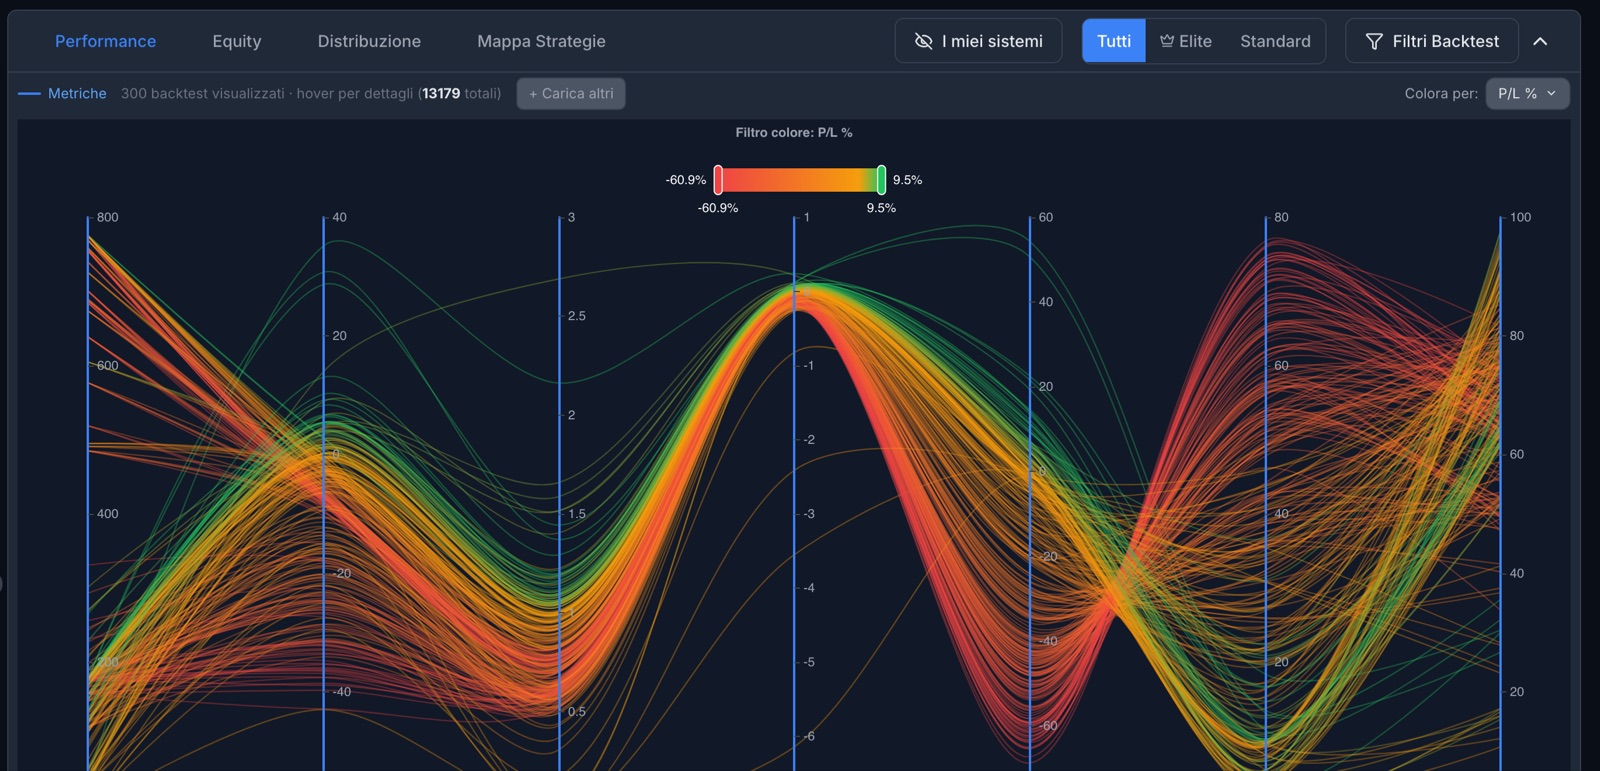
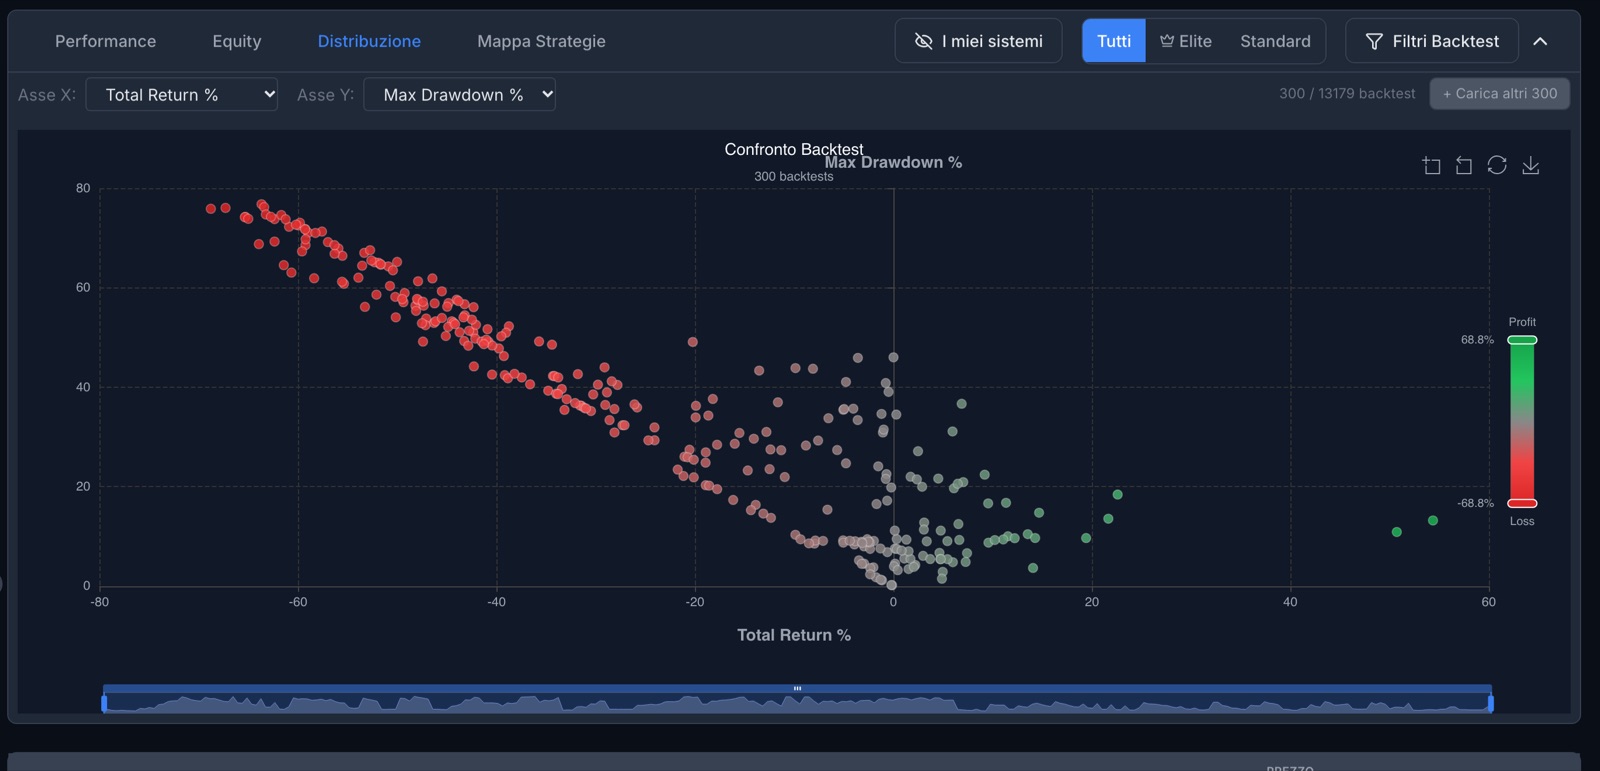
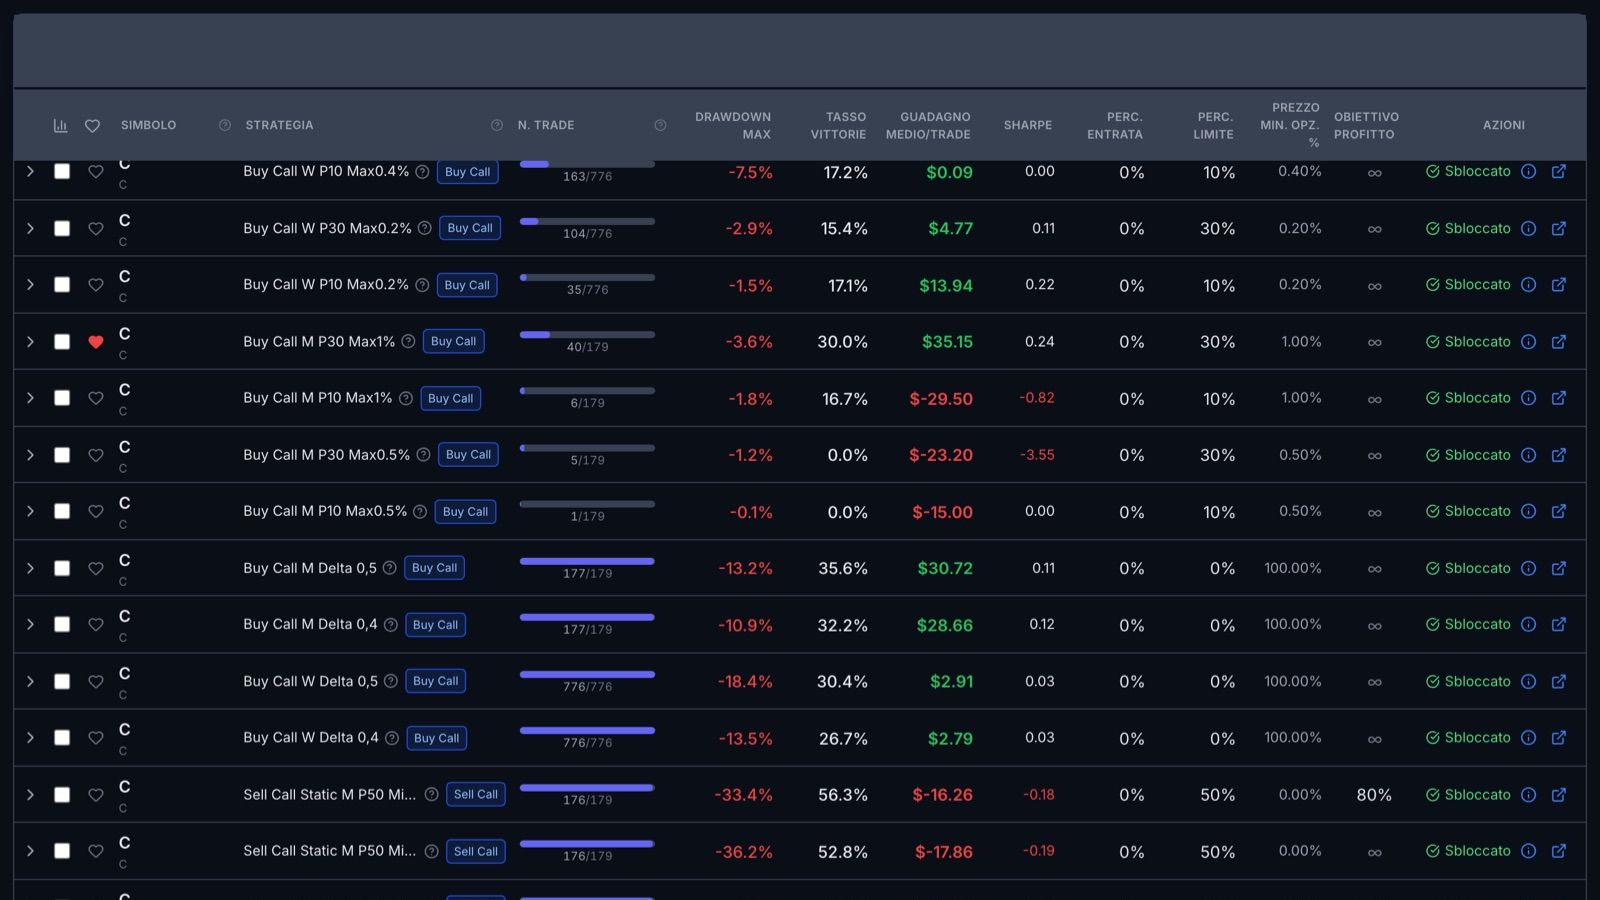
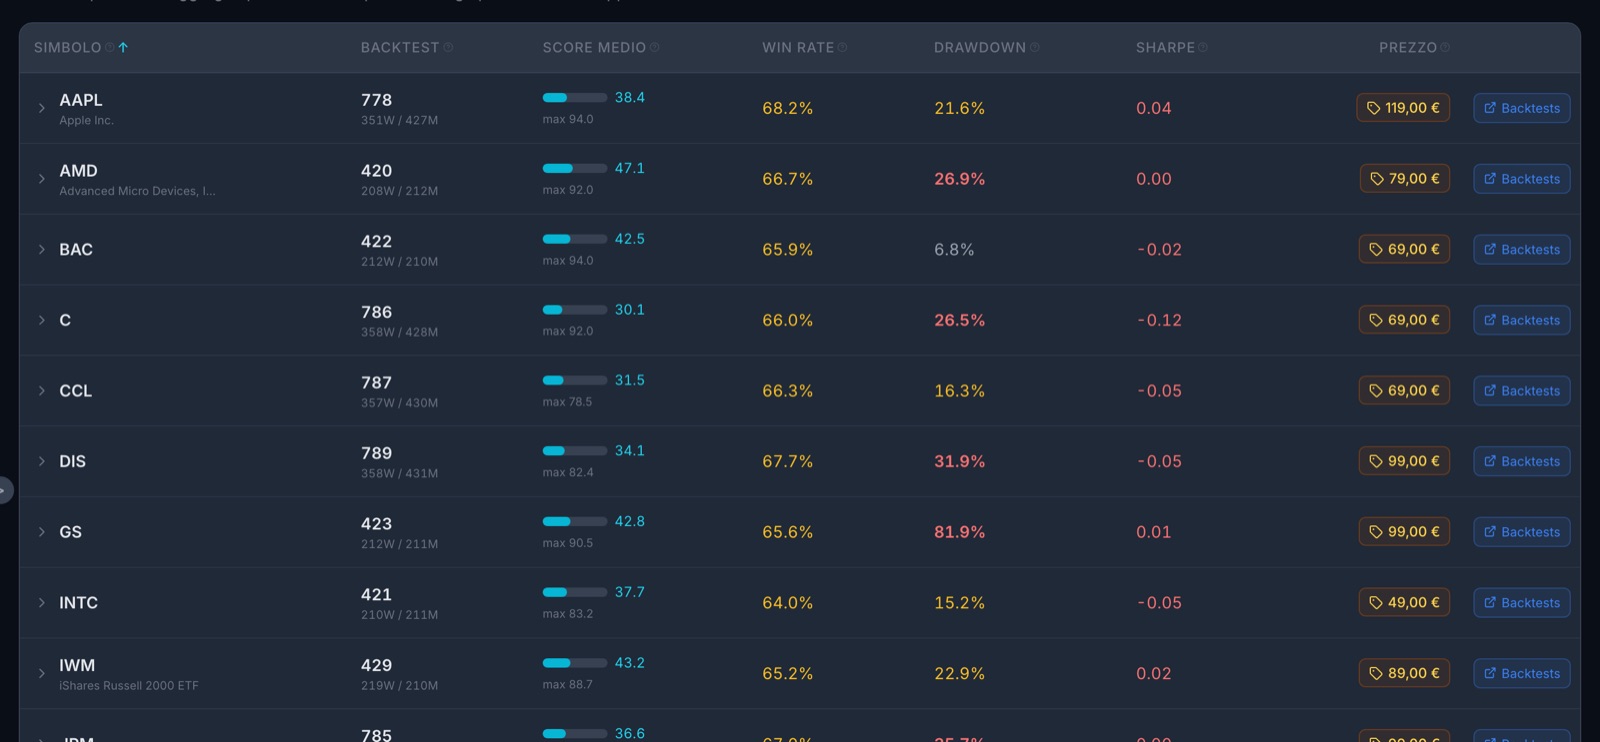
It is the page where choosing almost always begins. At the top you pick the market, the filter that narrows things down the most; below it you find the same set of systems read in four different ways. Changing view does not change the filters: you are looking at the same things from another angle.
- Performance: every system is a line crossing the metrics, so you immediately see the groups that do well and the ones that do not
- Distribution: every system is a dot, with two metrics of your choice on the axes, for example return and maximum loss
- Map: how the choices of a strategy lead to its results
- List: the table with every column, to sort however you like
Narrow it down before you read
Every filter you add lowers the count at the top. When it drops to a few dozen, you are ready to look at them one by one.
In every plan. Full Distribution and Map, and the advanced filters, with the Pro plan.
List
02 Filters
The filters: from the catalogue to a few dozen candidates.
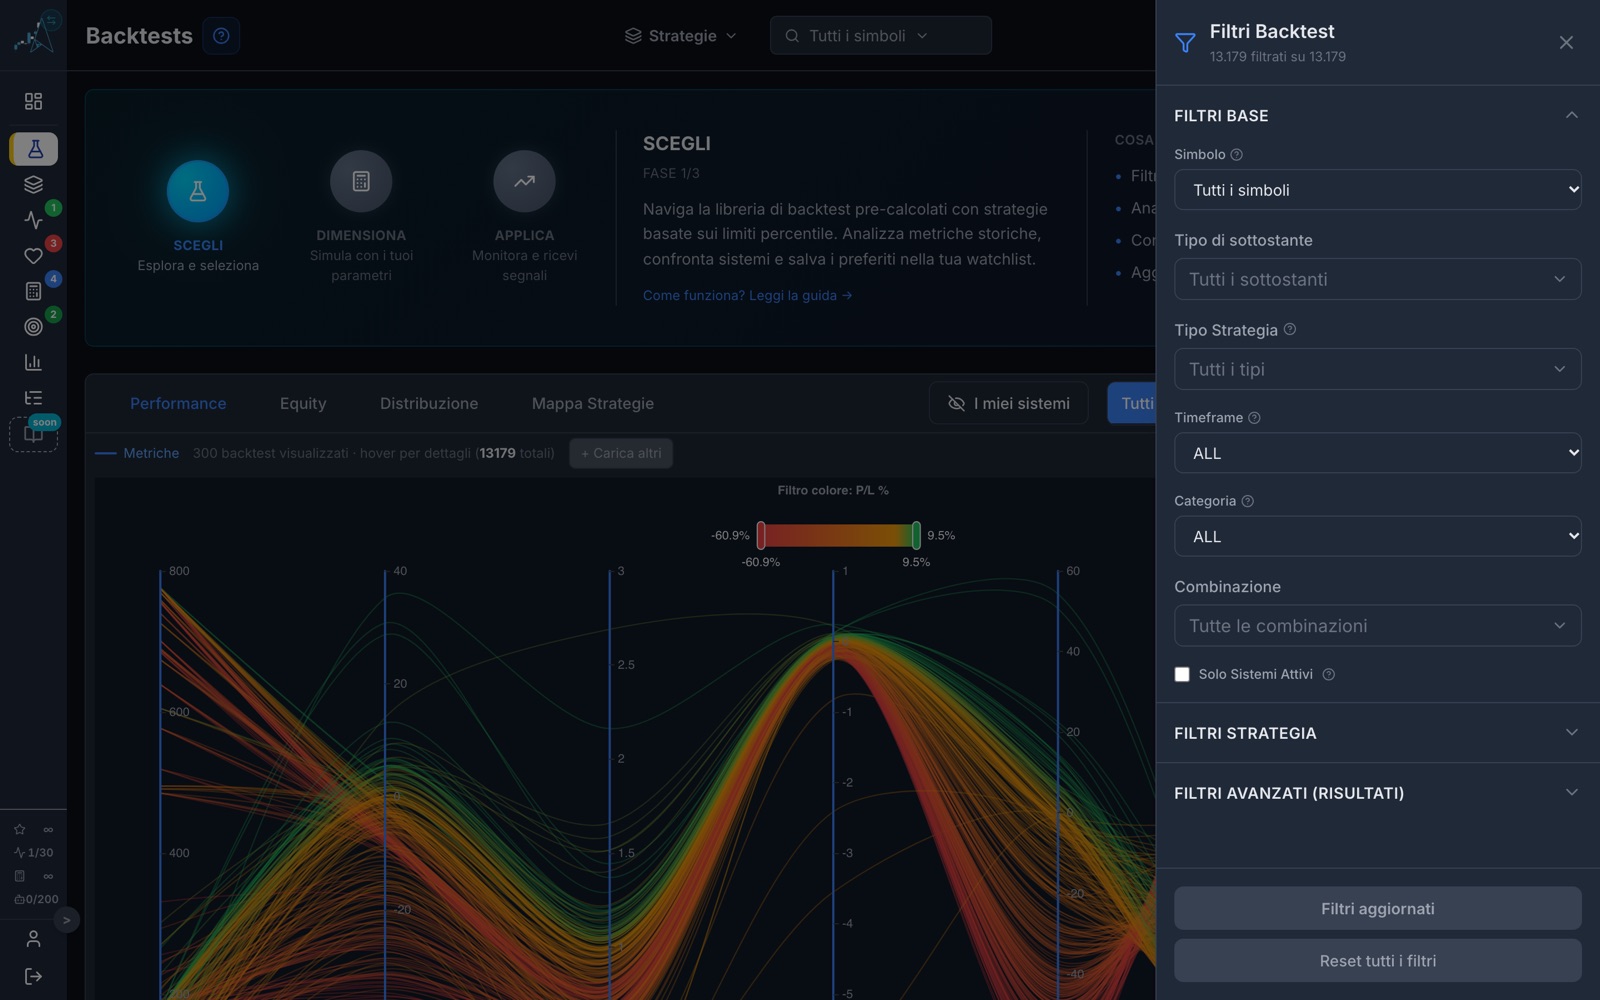
The filter panel opens at the side without making you lose the page. You start from the basic filters, market, type of underlying, weekly or monthly duration, combination, and work down to the results: how often it won, how much it lost, how much it returned.
- Basic filters: market, duration, combination
- Strategy filters: how and when the system enters
- Result filters: share of winning trades, maximum loss, return
- The preferences you give us when you first sign in become ready-made filters, and we always tell you so
Basic filters in every plan; strategy and result filters with the Pro plan.
03 Backtest Studies
The Studies: one market per row, seen from above.
Where the Screener takes you down into the single system, the Studies let you look from above: every row is a market, with a summary of all the systems calculated on it. How many there are, the average score, the average share of winning trades, the average loss.
- The score bar colours the average quality of the systems in that market
- Opening a row reveals the map of its systems: you see straight away whether the results are concentrated or scattered
- From there you go straight to the Screener, already filtered on that market
In every plan.
04 System detail
The card of a system: everything you need to decide.
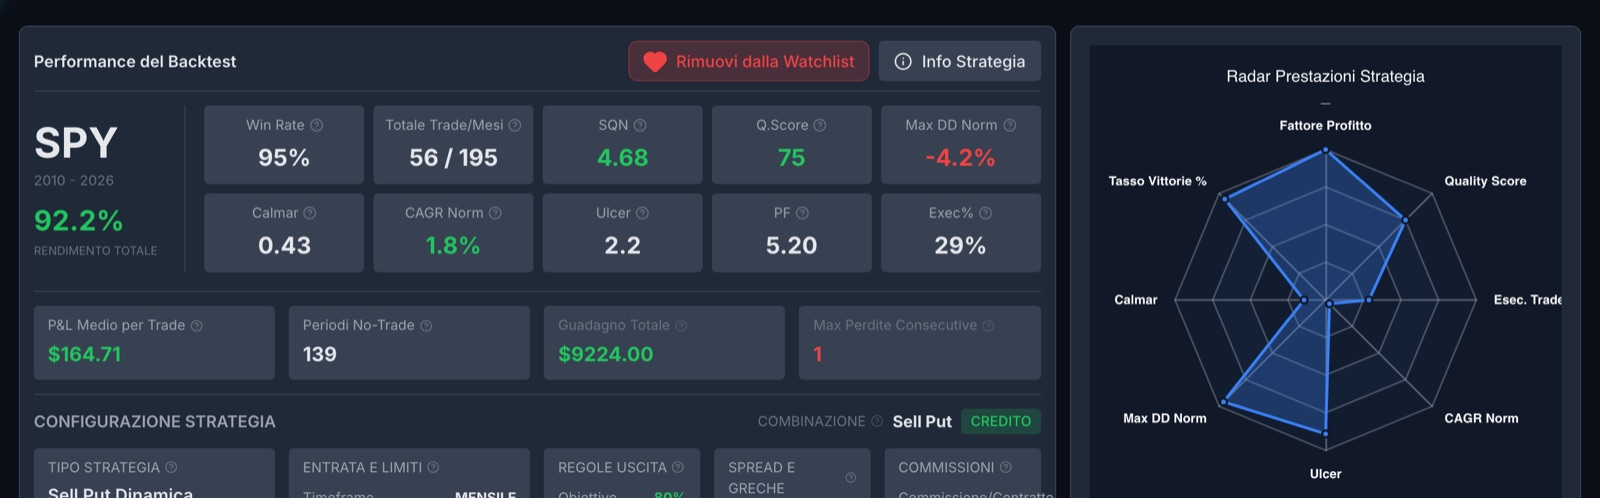
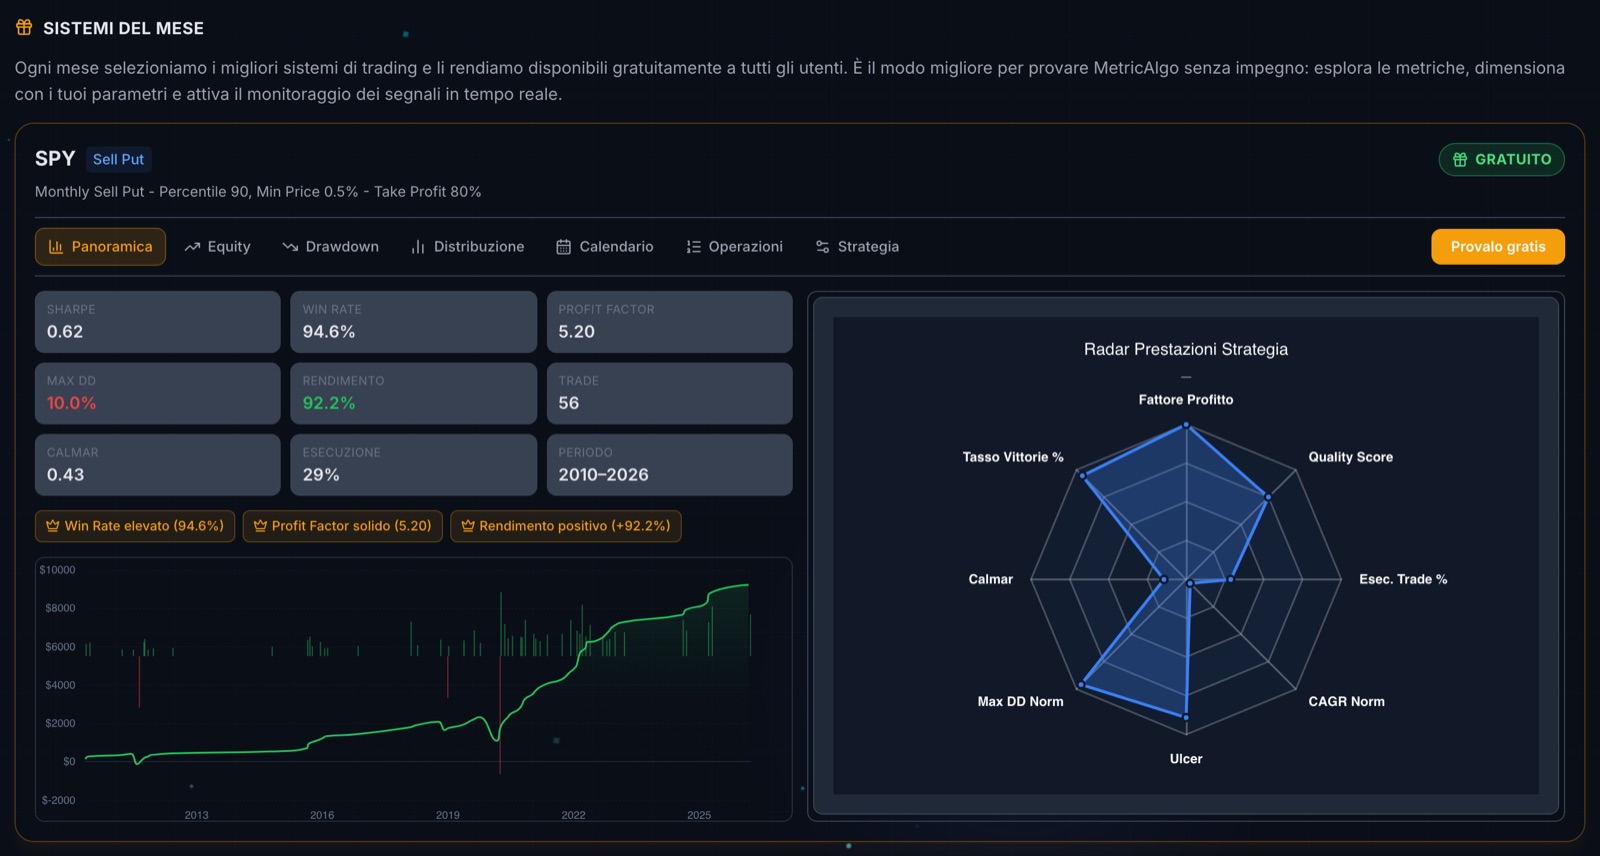
Every system has its card, and the card shows the uncomfortable parts too. At the top, the key numbers and a radar chart that tells you how balanced the system is: wide and even is better than one with extreme spikes. Below, seven sections to open only if you need them.
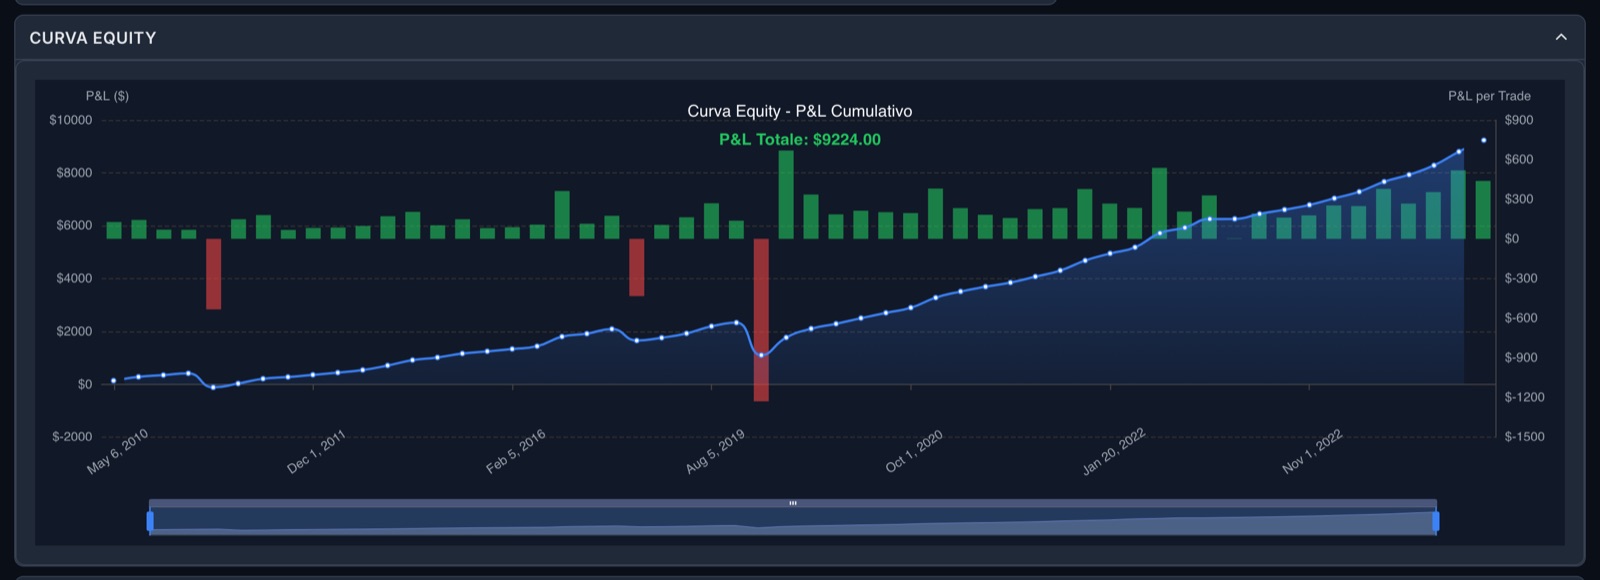
- Its progress over time, with every trade as a green or red bar
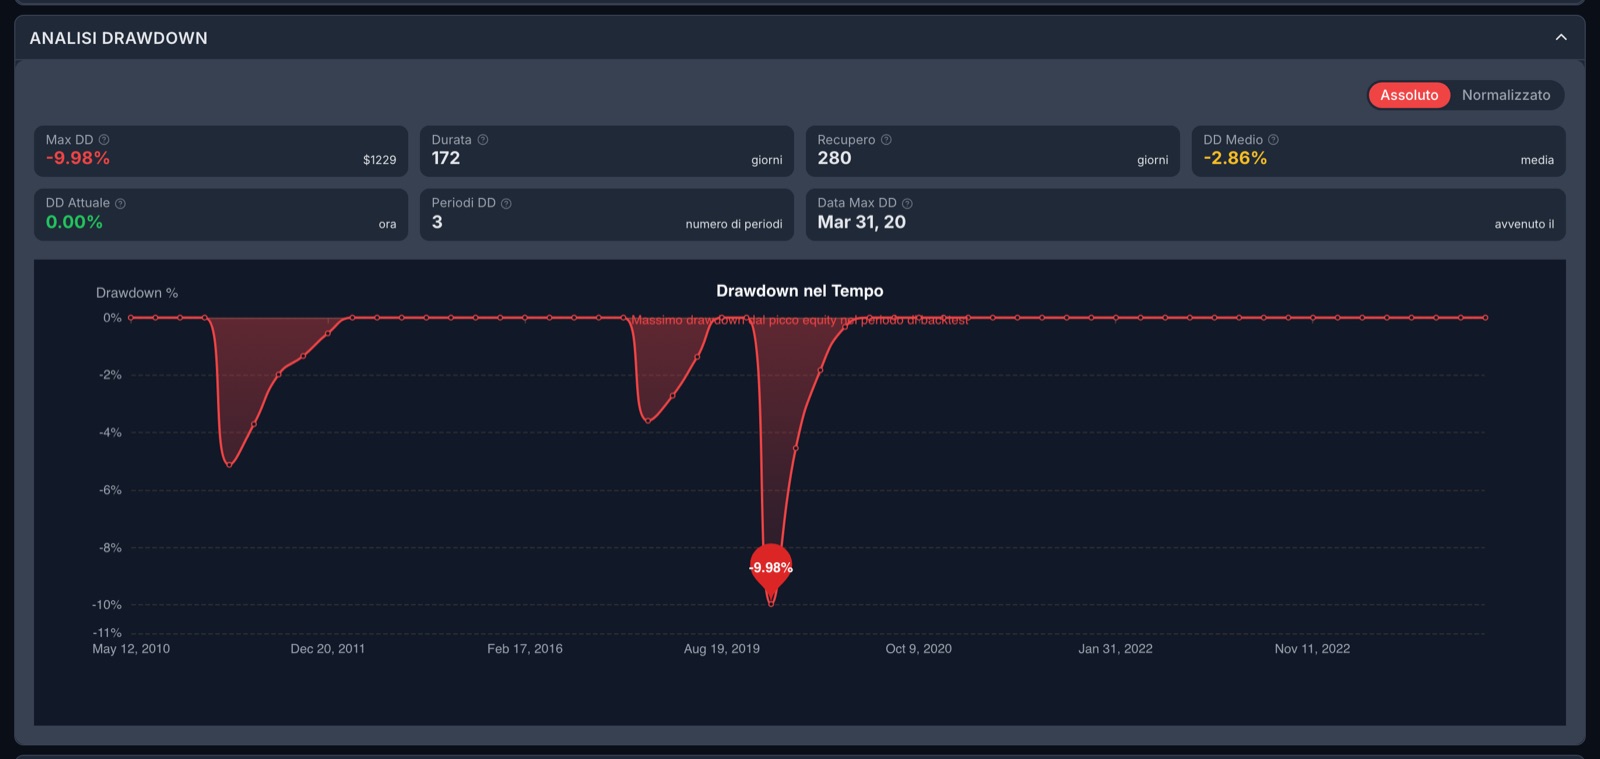
- The worst periods: how far it fell, for how long, how long it took to recover
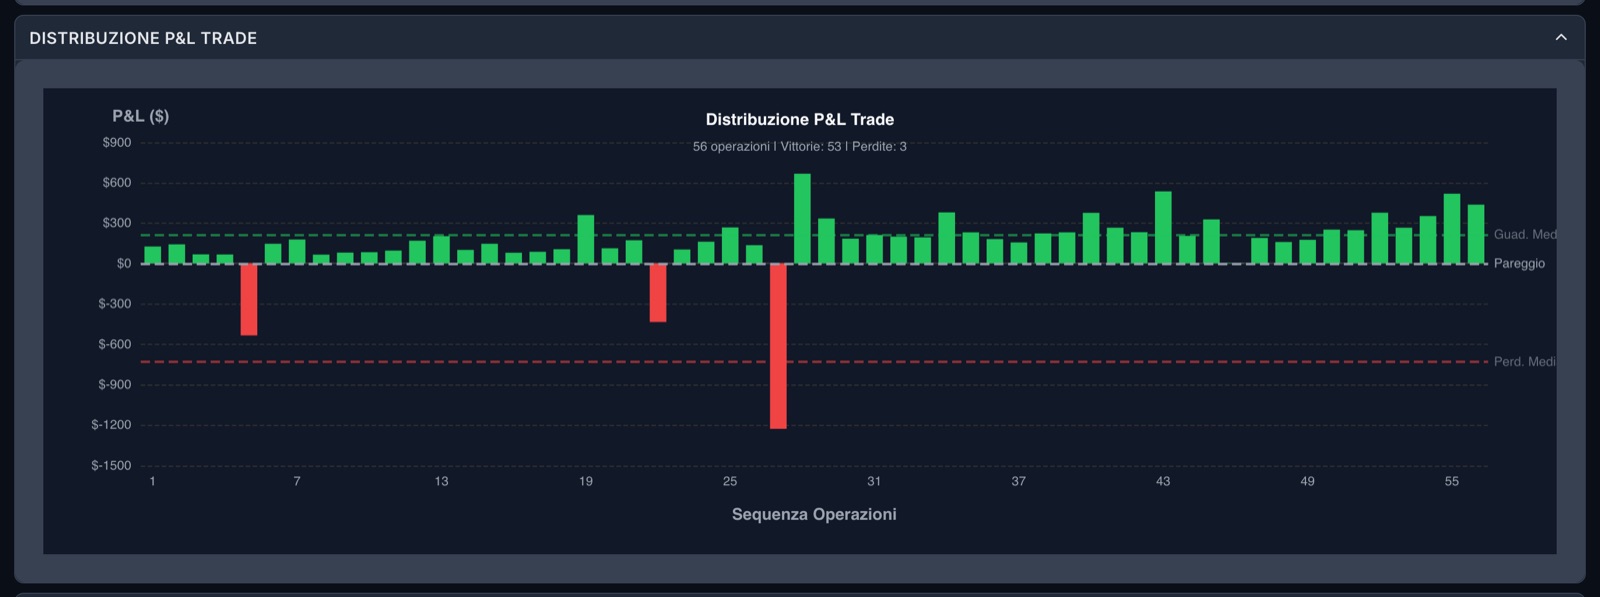
- The distribution of results, trade by trade
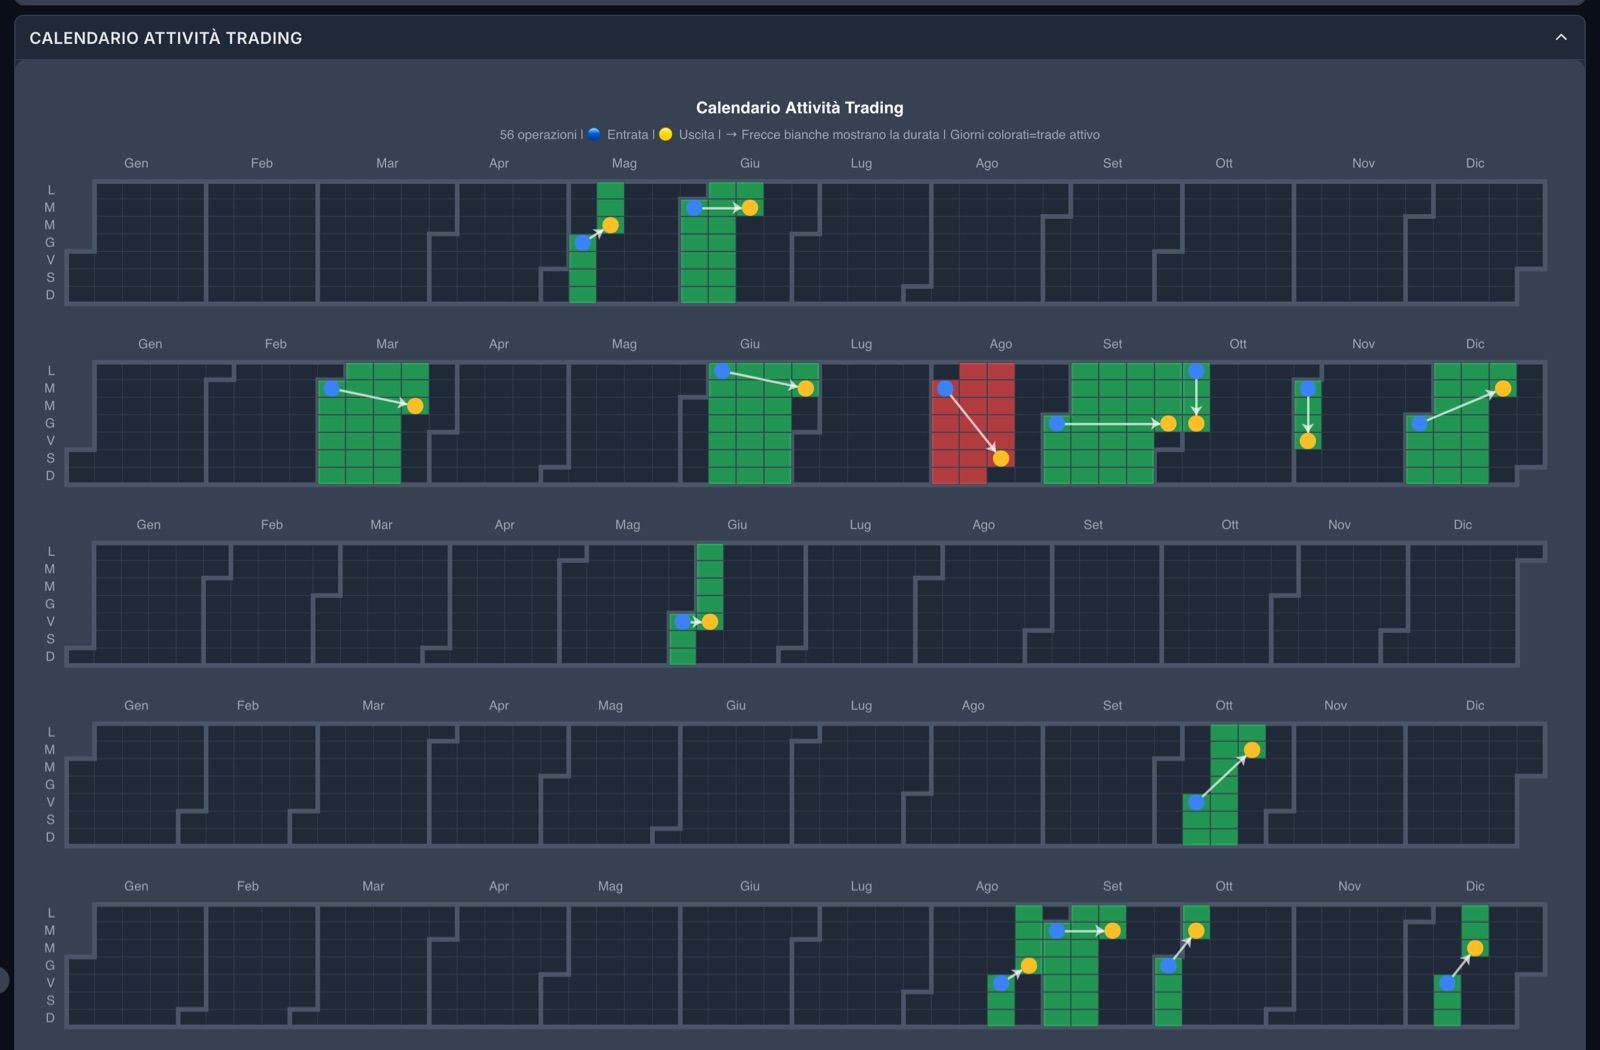
- The calendar: in which months and weeks the system traded, and how it went
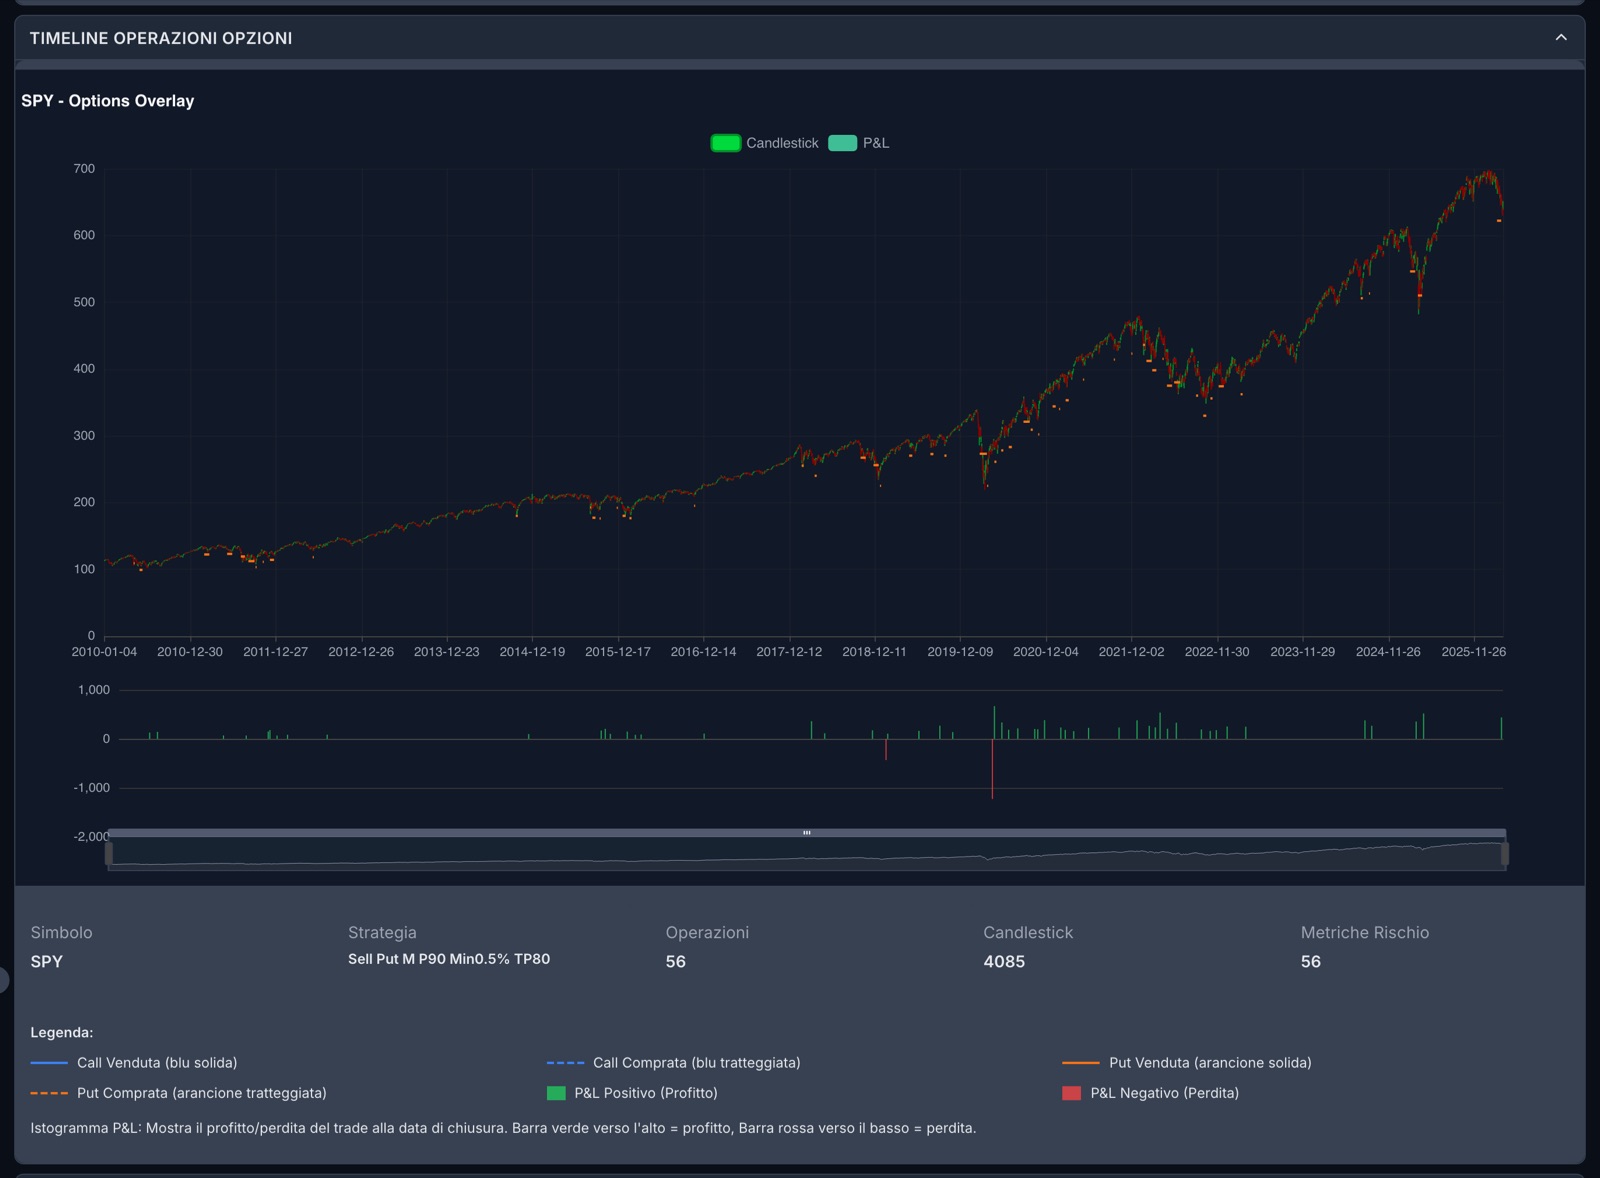
- The market price over the years, with the system’s trades on top
Do not stop at the first number
A high share of winning trades with a low average gain can hide a few very large losses. The maximum loss is the number to look at first.
In every plan. With the Free plan, the detail of the rules and of the individual trades is visible on unlocked systems.
The progress
The worst periods
Trade by trade
The calendar
On the market price
05 System of the Month
The System of the Month: a whole system, free.
Every month we pick one of the best systems and open it to everyone, in full. It is the quickest way to learn how to read a card, and to try the whole path, choose, size and apply, without spending anything.
- You find it on the dashboard, with all its cards
- You size it and turn it on like any other system
- It does not take up your active system slot
Free, in every plan.
Another way to choose: start from what is happening right now.
The Active Systems page shows, in real time, the notifications of every system on the platform, including the ones you do not follow. It is monitoring, but it is also a way to discover systems that are working well right now.
The mistake to avoid: choosing by the percentage alone.
95% winning trades says nothing on its own. Always look at the maximum loss too, how long it took to recover and how many trades lie behind it: a high number over a few trades is worth less than a slightly lower one over hundreds.
Found one that convinces you? Set it aside.
The heart on a system adds it to your watchlist. That is the step into the next phase: from then on you work only on the systems you chose, and you try them on your own capital.